2023 Retrospective
Rounding up the past year of my life and taking a look at what's coming next
It’s that time again where I try to remember all the things that happened the past year. What went well, what didn’t go well, and what I want to do more of.
So let’s get started…
Life at Octopus Energy
One nice thing about these yearly updates is that they fall just before the anniversary of me joining Kraken, part of the wider Octopus Energy Group.
It’s now been 2 years since I joined, which has flown by. I was going to say that I’m as excited as when I started but let’s be real, I’m even more excited than when I started – I’m having the time of my life here 😅
It’s been a big year for the group, with the cherry on top being Octopus Energy ending the year as the largest electricity supplier in the UK. When I joined in 2022 they were 5th largest, and they didn’t even exist 9 years ago!
There are so many amazing things that are being worked on across the group, too many to list here. Needless to say, I genuinely believe that we’re changing the world for the better and I’m proud to be a very small part of it.
Want to join us on this journey? We’re hiring!
Releasing Octo House
Octo House is a 3D “scrollytelling” experience I worked on that showcases various low-carbon tech for homes. Technically the project was created in 2022 but it was only released to the public in 2023 so I’m including it here.
I owe you a super-detailed write-up about how I made it, but for now here’s a summary of the tech:
- All the 3D models are bespoke, created in Blender
- Animations and camera movement are configured using Blender
- Visualised in the browser using WebGL via React Three Fiber (three.js)
- Heavy use of texture baking and glTF optimisation to keep performance high and file size as low as possible
- Animations are triggered on scroll using React Scrollama
Visualising energy data
We’ll be here all day if I listed every project that I’ve worked on this year so instead I’m going to highlight some of the key themes.
I won’t be able to talk in detail about everything as some projects are internal or not released yet, though I’ll do my best to at least summarise the sorts of things I’ve been working on.
Maps, maps and more maps
The majority of projects I’ve been working on involve maps or spatial data in some way, which probably comes as little surprise if you know me.
In terms of technology, most of the projects have been using Mapbox GL JS as well as complex Deck.gl layers. Animation on maps has also been a big theme this year and I’ll touch on a specific example of that in a moment.
Tools to encourage consumer adoption of renewable technology
Towards the end of the year I’ve been working on a project that walks consumers through purchasing and installing renewable technology in their homes. I can’t talk about it much as it’s still in progress but it’s been a lot of fun so far and I’m excited to see it released.
What I can say is that it’s an interesting mix of techniques and technologies and uses some cutting-edge data that I’ve been itching to work with for a while now.
These projects are satisfying as they have an immediate, tangible impact due to being consumer-facing. It’s also kinda cool knowing that something you’ve worked on might help make the difference between someone installing renewable technology or not, and ultimately help reduce carbon emissions.
Storytelling tools to influence change
Another big theme this year has been creating visualisations and tools to help tell stories and influence change at national and global scale.
A lot of these projects have been internal visualisations that are on physical screens in our offices and used to either show what we’re able to do, or explain why we think something is important enough to require action.
It’s quite fulfilling having your work on display and being seen by all sorts of important people as they visit the office. They’ll likely never know I made them (and why should they) but it’s still cool to know that I’ve helped play a very small part in influencing change.
Digital twins from sensor data
Similar to the storytelling visualisations, I’ve also worked on a number of projects that are displayed in our offices and use sensor data to create digital twins of real-world objects.
One example is a project that visualises the performance of heat pumps using high-resolution sensor data. As with most projects here, it was particularly interesting as it gave me the opportunity to gain a deeper understanding about a specific technology and how it works.
Timelapses showing high-resolution energy data
I previously mentioned that I’ve been working on a lot of spatial visualisation projects. Most of these visualisations involved a temporal aspect, which is a fancy way of saying that they show how things change over time.
One of these projects is an interactive timelapse showing electric vehicle charging based on the Intelligent Octopus Go tariff.
It was a particularly fun project as it involved a lot of data processing and optimisation to make it work, and the end result is pretty cool. You can clearly see the breathing pattern that occurs every night as electric vehicles are charged according to the Intelligent Octopus Go scheduling system.
Another aspect that I enjoy about these projects is that they make the invisible… visible. Even if you could read all the raw charging data, it’s not until you see it visualised that the patterns start to emerge.
Starting the Data Visualisation team
Arguably the biggest event of the year for me was starting and leading my own team here! It’s also a career first for me as I’ve never led a team before, at least not officially. So no pressure.
Until recently there was no dedicated team that focussed on data visualisation – especially for the Web – it was just little old me bouncing around different teams working on various projects. And while this was a lot of fun, it wasn’t sustainable and I was being stretched too thin.
As of December 4th I now lead the Data Visualisation team, which has doubled in size to a massive two entire people (myself included). That second person is Erik Escoffier, who has an impressive background and I highly encourage you to check out his amazing work.
It’s been a long time coming and I’m excited to see what we can achieve.
Side projects
If you’ve been following me on Twitter and LinkedIn then you’ll know that I’ve been working on a bunch of side projects this year.
After all, why settle for dumping hours of your life into a day job when you can dump countless more into your own stuff over evenings and weekends, right?
Launching the Renewables Map
Back in 2022 I started a project that I referred to as a “live map of wind generation in Great Britain.” What I didn’t know at the time was quite how much that project would take off in 2023.
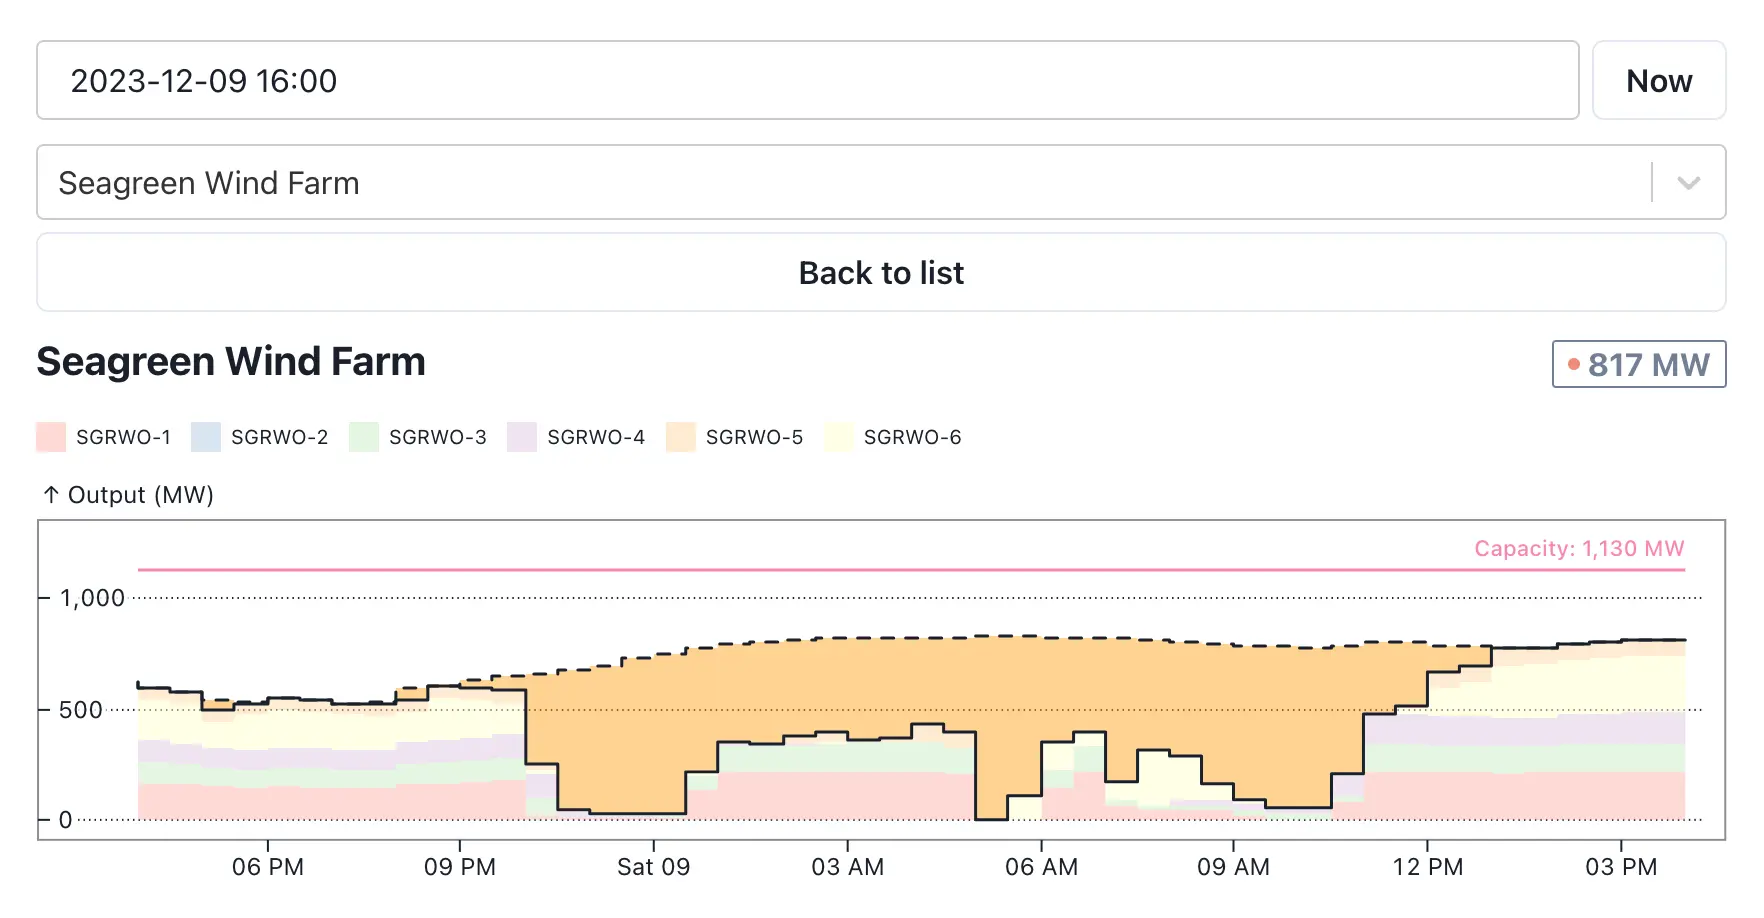
Fast forward to March this year and I released the first version of the project, which I now call the Renewables Map. It’s a live map of renewable wind generation in Great Britain, showing the current and historical generation as well as all sorts of other interesting data.
Since then I’ve added numerous features and improvements, one of my favourites being a “What If?” mode to forecast how much electricity near-future wind farms would be generating if construction was completed today.
I’ve also added a bunch of tools to explore wind curtailment and gas turn-up, which I’ll talk about in a moment.
The response has been amazing and I’ve had a lot of fun working on it. I’ve also learned a lot about the energy industry and how the electricity grid works, which was the main reason I started the project in the first place.
It really deserves its own blog post so I’ll leave it there for now. I have a lot more planned for the project and I’m excited to see where it goes from here.
Let’s just say what you see now is only the beginning…
Experimenting with scripted “weather forecast” videos for wind generation
I’ve also been experimenting with creating scripted videos that show wind generation in a similar style to weather forecasts. You could call this one a side project of a side project as it’s a spin off from the Renewables Map.
It uses Remotion under the hood, which is a React-based framework for creating programmable videos. It took a little while to get everything working nicely with an animated Web map but I got there in the end.
I definitely plan to revisit this one and expand on what I’ve built so far.
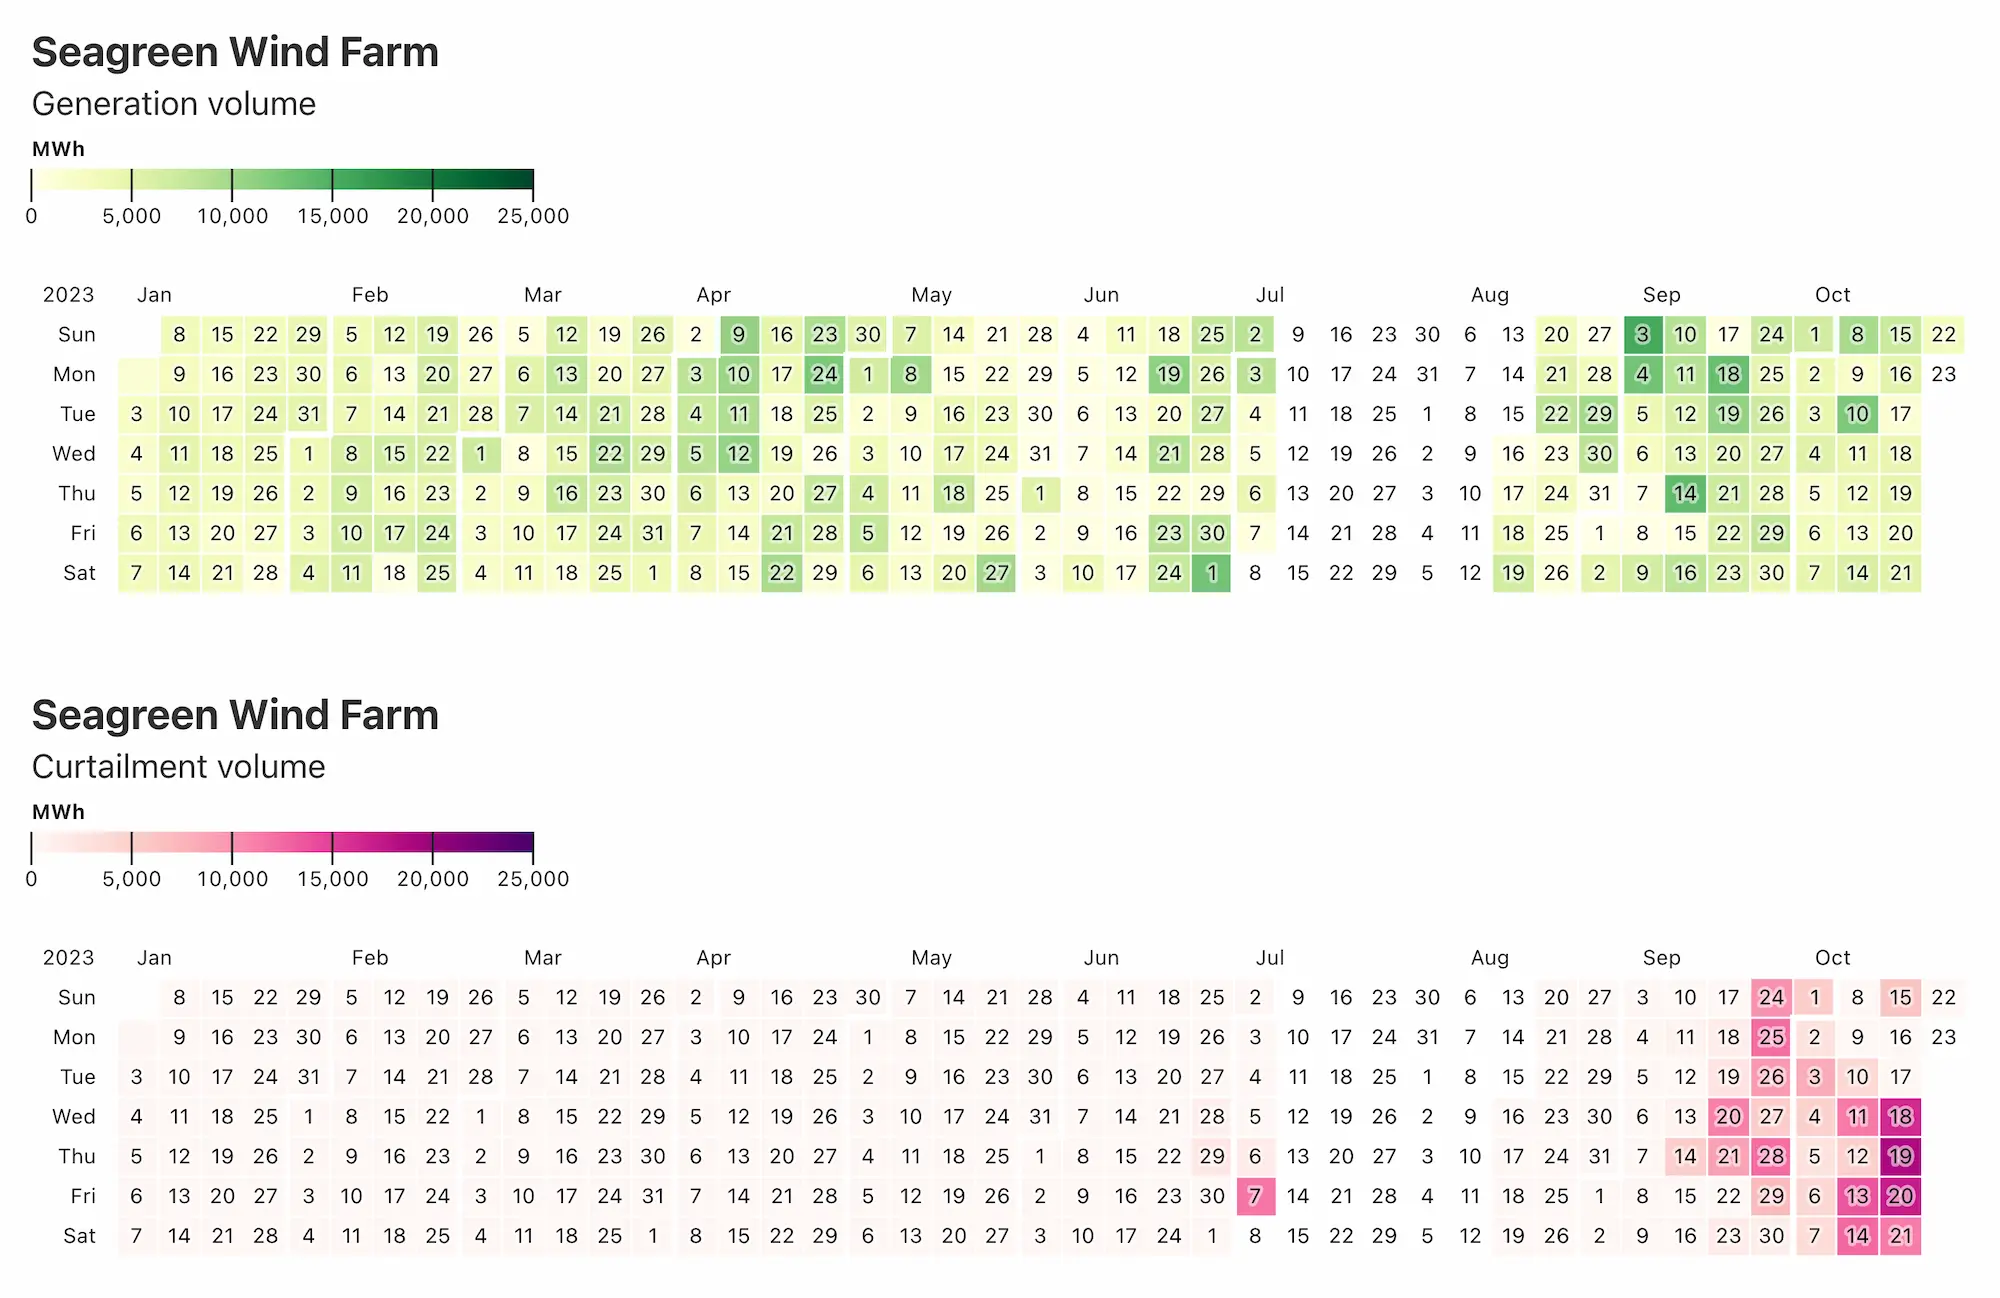
Creating tools to explore wind curtailment and fossil fuel turn-up
As part of the Renewables Map I’ve been working on tools to explore wind curtailment and – more importantly – fossil fuel turn-up. Together these are two big challenges facing the energy transition and I’ve been obsessed with trying to understand them better.
I won’t pretend to be an expert but here’s my very simplistic explanation…
In this case curtailment is when wind farms are paid to reduce their output or stop generating entirely. This is often because of limitations in the electricity grid, such as too much electricity being generated in one area and limitations in the grid making it impossible to send it to where it’s needed.
Curtailment is the deliberate reduction in output below what could have been produced in order to balance energy supply and demand or due to transmission constraints.
– Wikipedia
It’s sort of like using a thin straw when drinking a thick milkshake, no matter how hard you try you can only suck so much through the straw. If you want to drink more you need a wider straw. In terms of the electricity grid the cables and substations are the straw, which need to be upgraded to handle the amount of electricity we demand.
The result? Not only are some wind farms paid to effectively turn off when it’s windy, but fossil fuel power stations are then paid to turn on to make up the difference. It’s a waste of renewable energy and also means releasing a large amount of carbon emissions.
Now there’s much more to it than that, but ultimately it’s a complex problem that needs to be solved if we’re going to reach net zero. And the answer isn’t to build less wind farms, it’s to modernise the electricity grid so that it can handle the amount of wind farms we must build.
Solutions are already in progress, and in the meantime I’m going to keep exploring the data and finding ways to visualise it so others can better understand this obscure aspect of the energy transition.
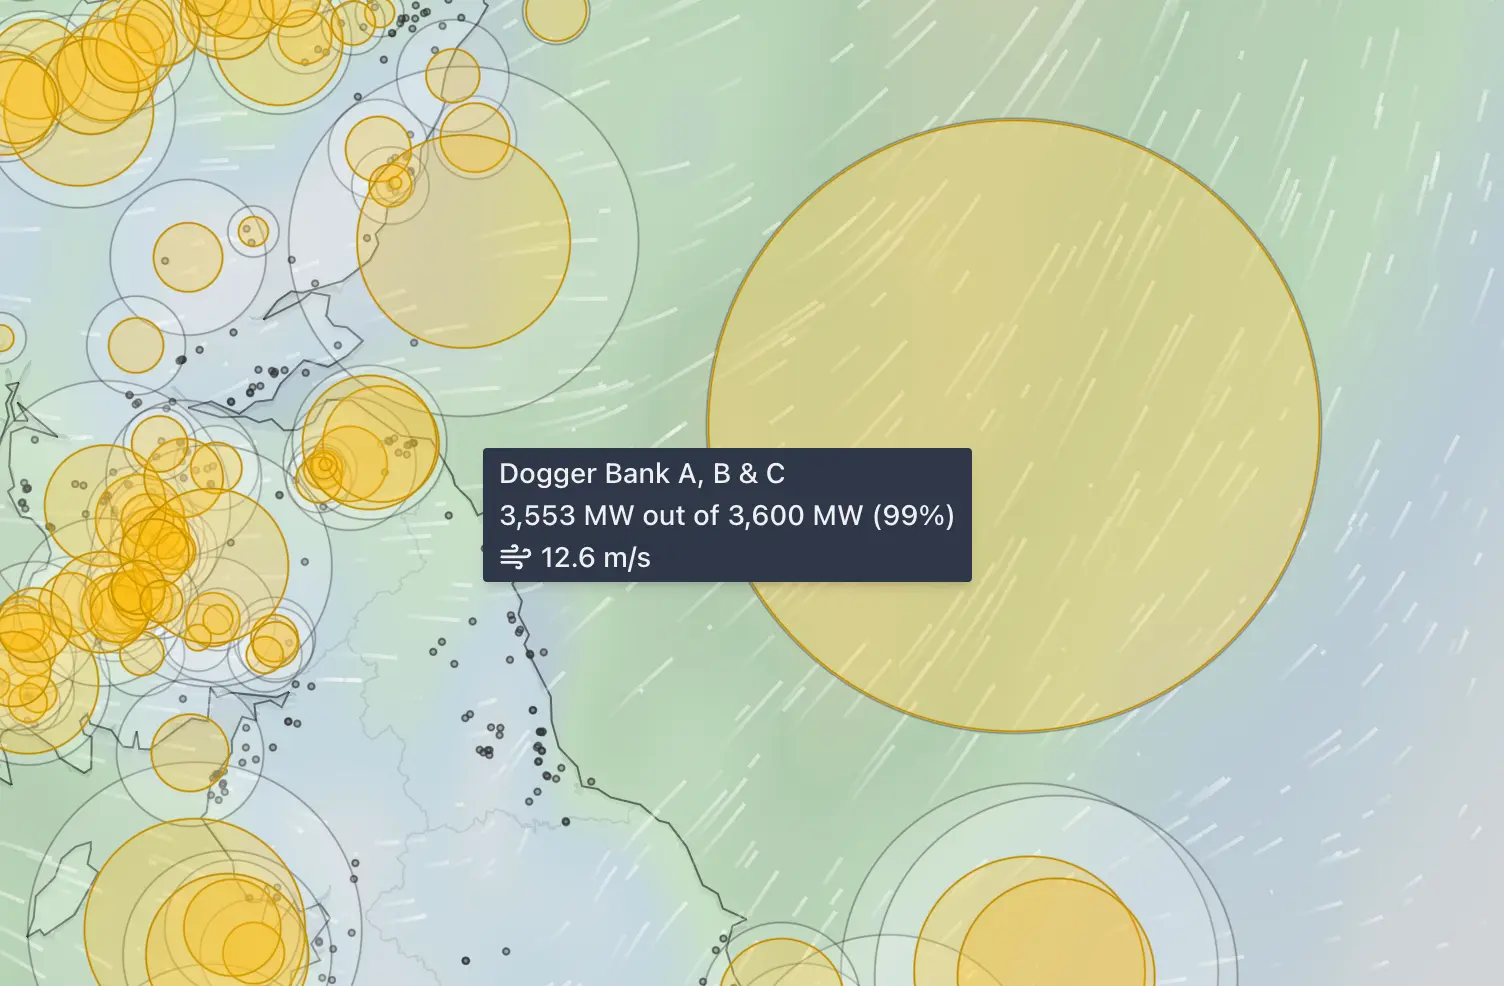
Obsessing about the construction of Dogger Bank wind farm
If you hadn’t already guessed, I’m turning into a bit of a nerd for renewable energy and wind farms in particular. So you can guess my excitement when I learnt that the world’s largest offshore wind farm – Dogger Bank – is being constructed just off the coast of the UK right this very moment.
I’ve been aware of this wind farm for a while but it wasn’t until I started working on the Renewables Map that I realised just how f***ing big it is.
![Historic vessel positions at Dogger Bank using AIS [Data: Kpler]](/content/images/2023/12/dogger-bank-ais-timelapse.gif)
Every aspect of it is ginormous and record breaking; from the size of the turbines (260 metres tall), to the amount of electricity it can generate (3.6 Gigawatts), to the size of the vessels used to construct it (they big).
Want a cool stat? The wind turbines are so massive that just one turn of the blades can power an average home for 2 days. And there will be 277 of these ginormous turbines. That’s a lot of homes being powered for each rotation.

As a result I’ve been quite frankly obsessing over the construction of Dogger Bank and have been following it closely. I’ve also been creating visualisations to show how it’s progressing, combining contextual data such as Synthetic Aperture Radar (SAR) from satellites as well as historic positions of the individual ships involved in the construction.
I’m only just getting started and hope to have a lot more to show next year.
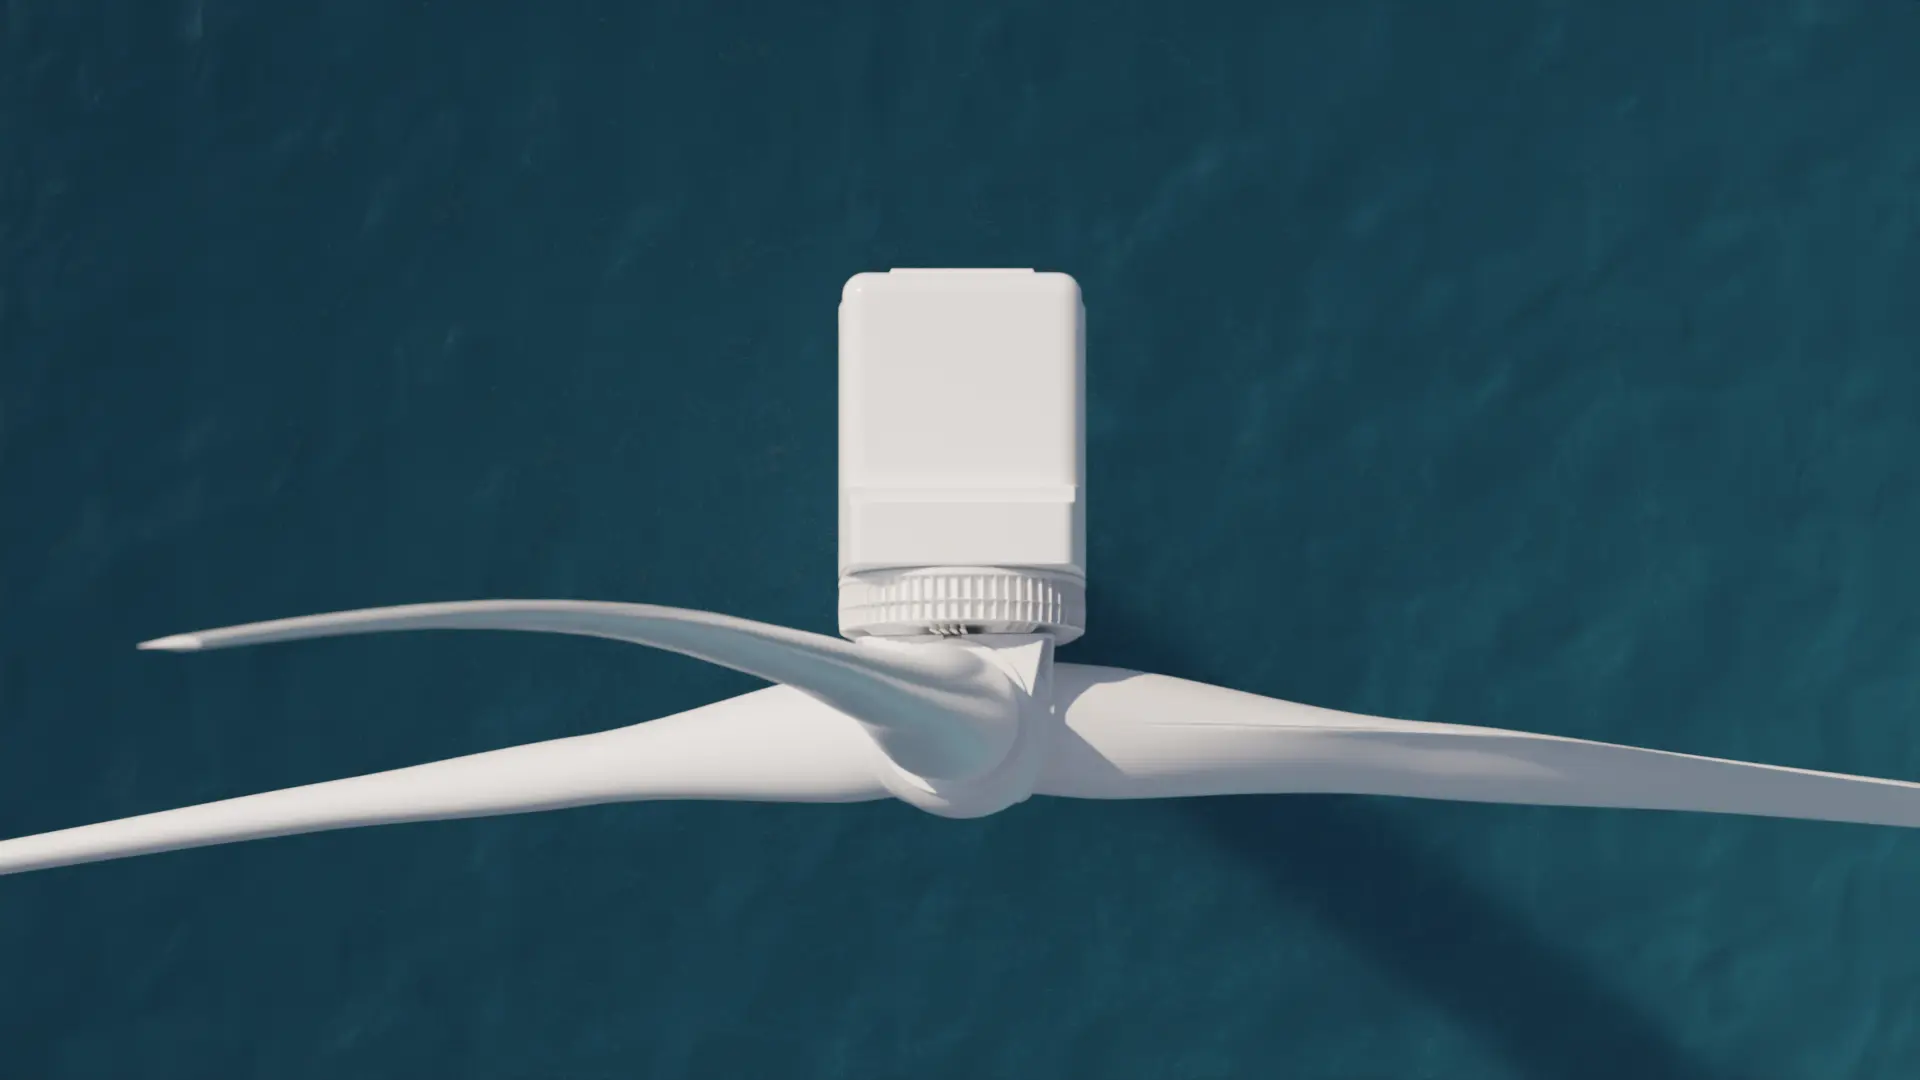
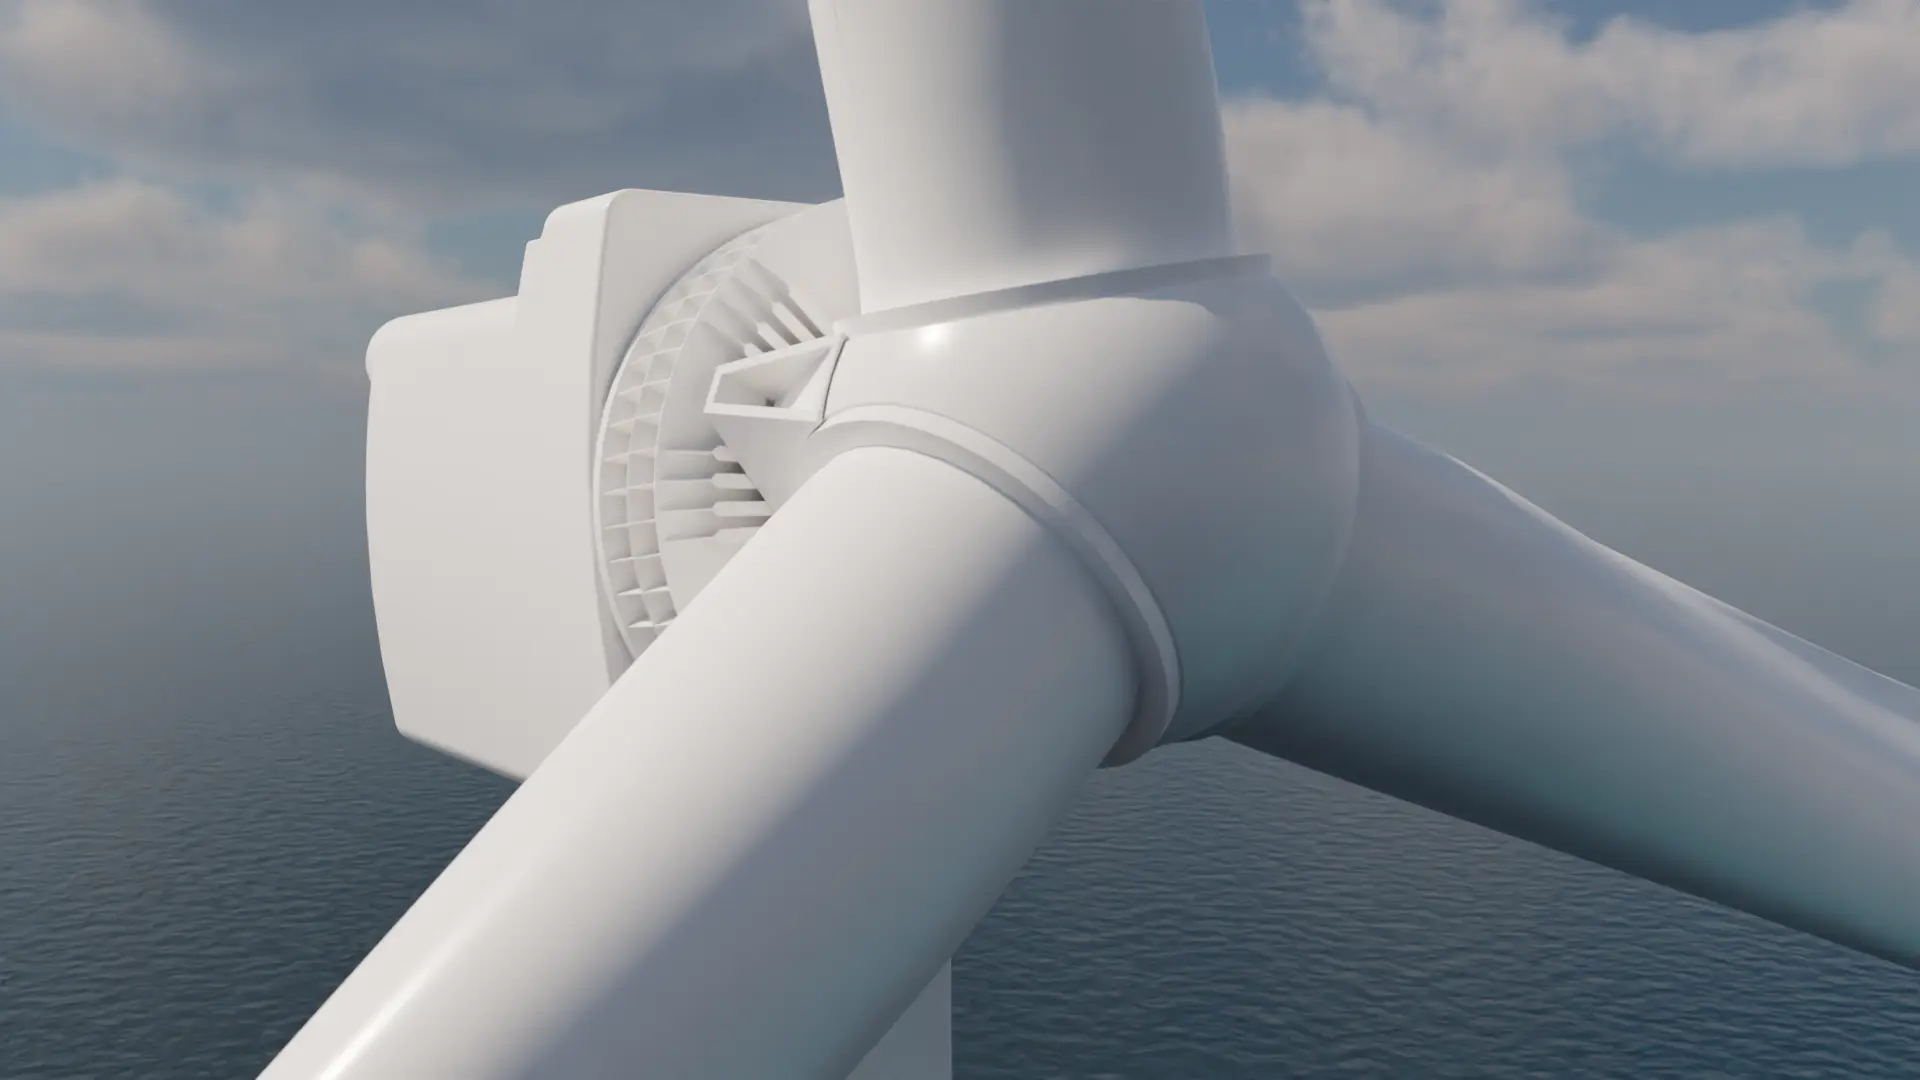
Creating a realistic Haliade-X wind turbine in Fusion 360 and Blender
The ginormous wind turbines being used at Dogger Bank are Haliade-X turbines, which have turned into a bit of an obsession in their own right.
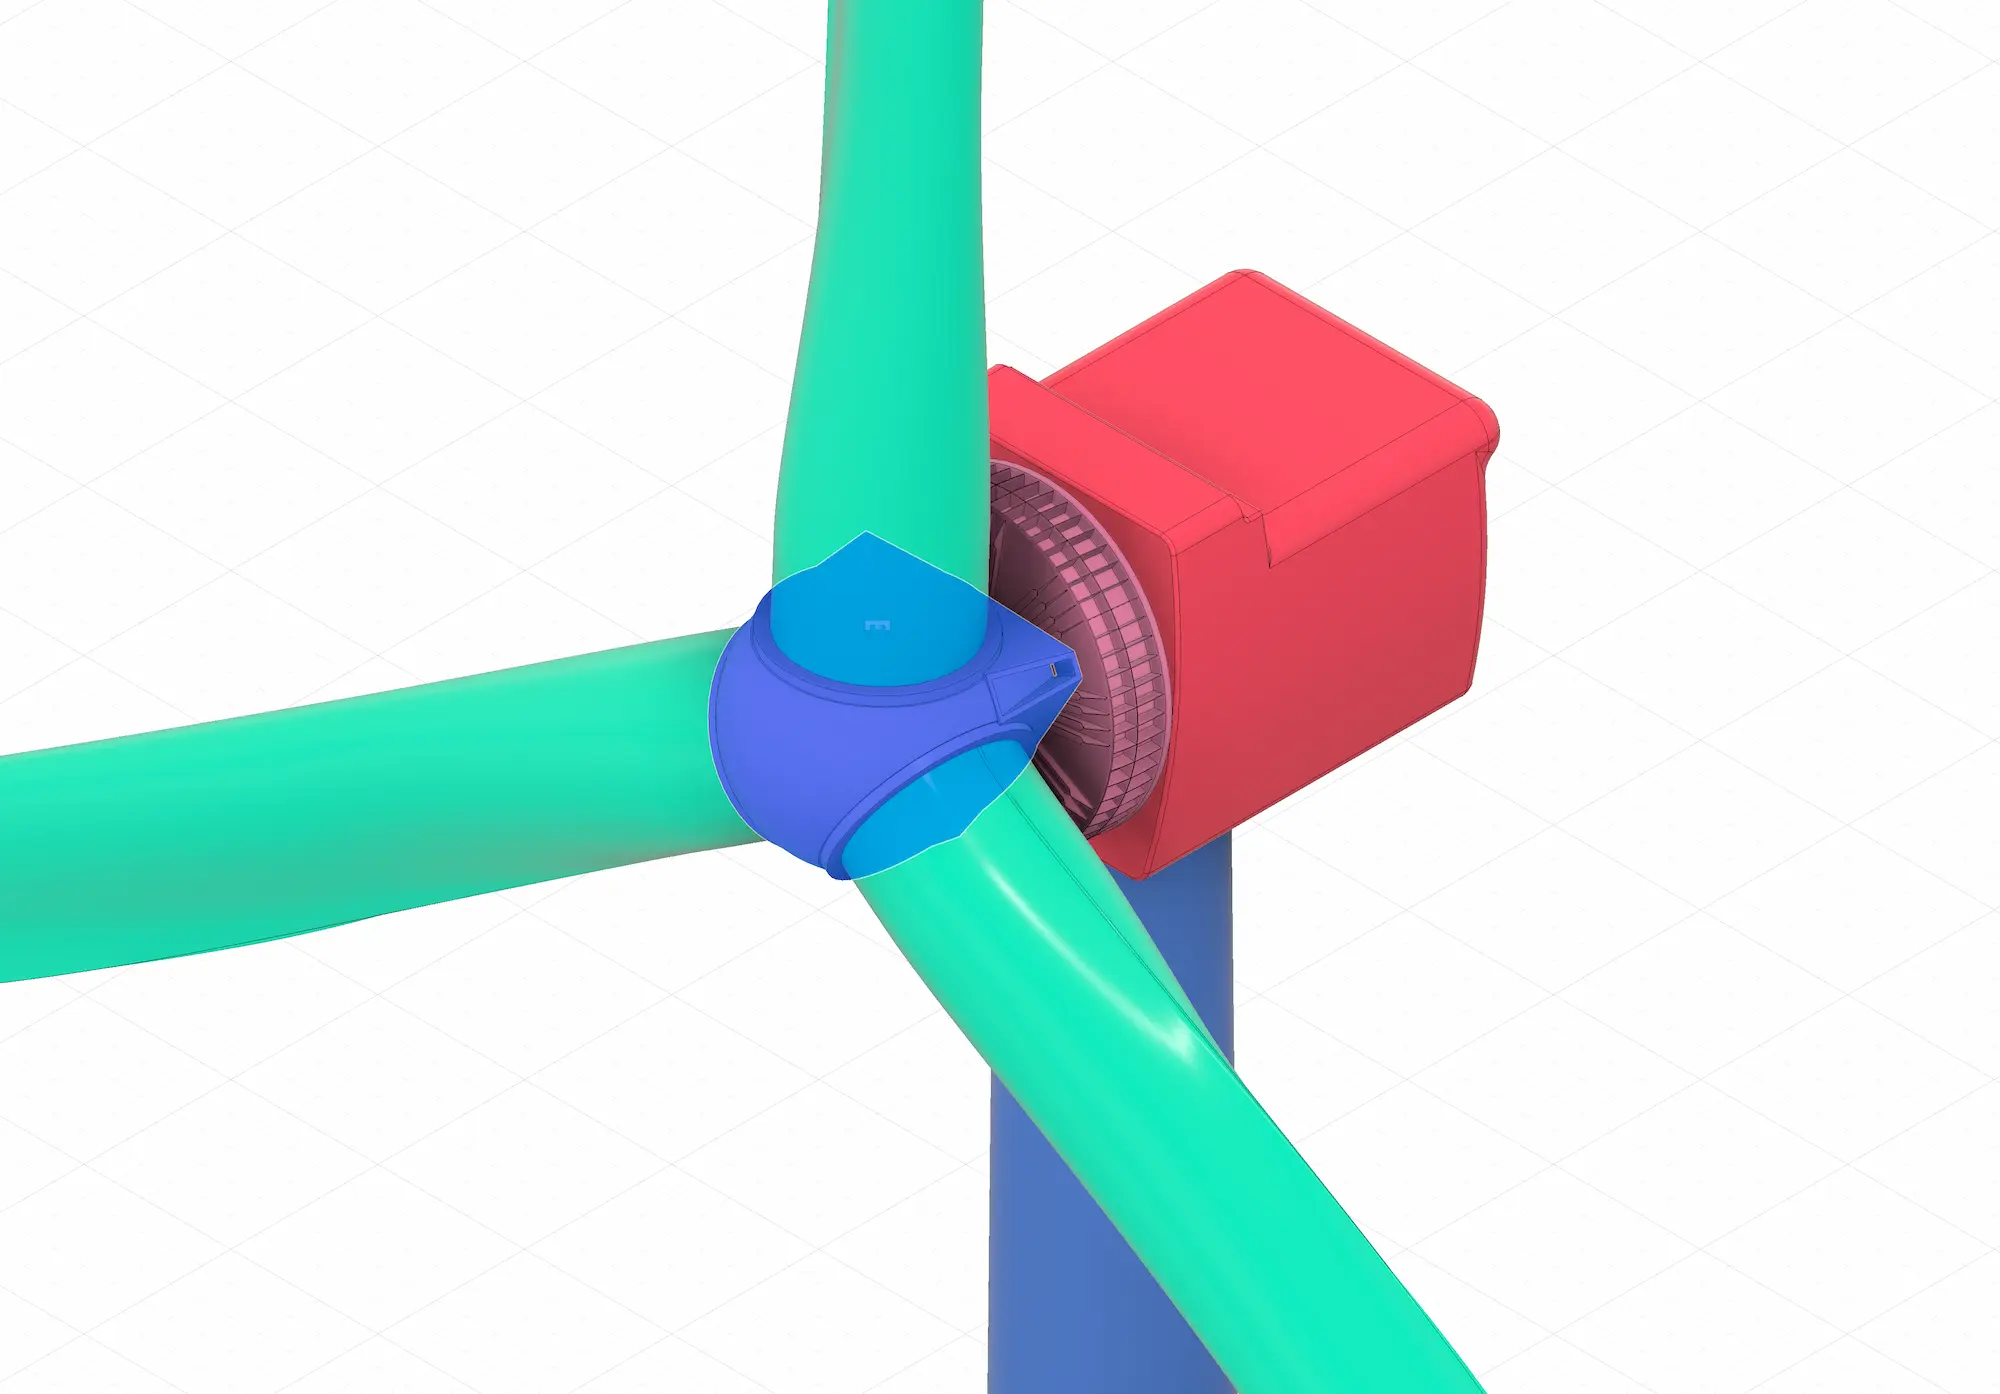
So I did what any normal person would do and poured many hours into learning how to use Fusion 360 and Blender to create a realistic animated 3D model of the Haliade-X turbine from scratch.
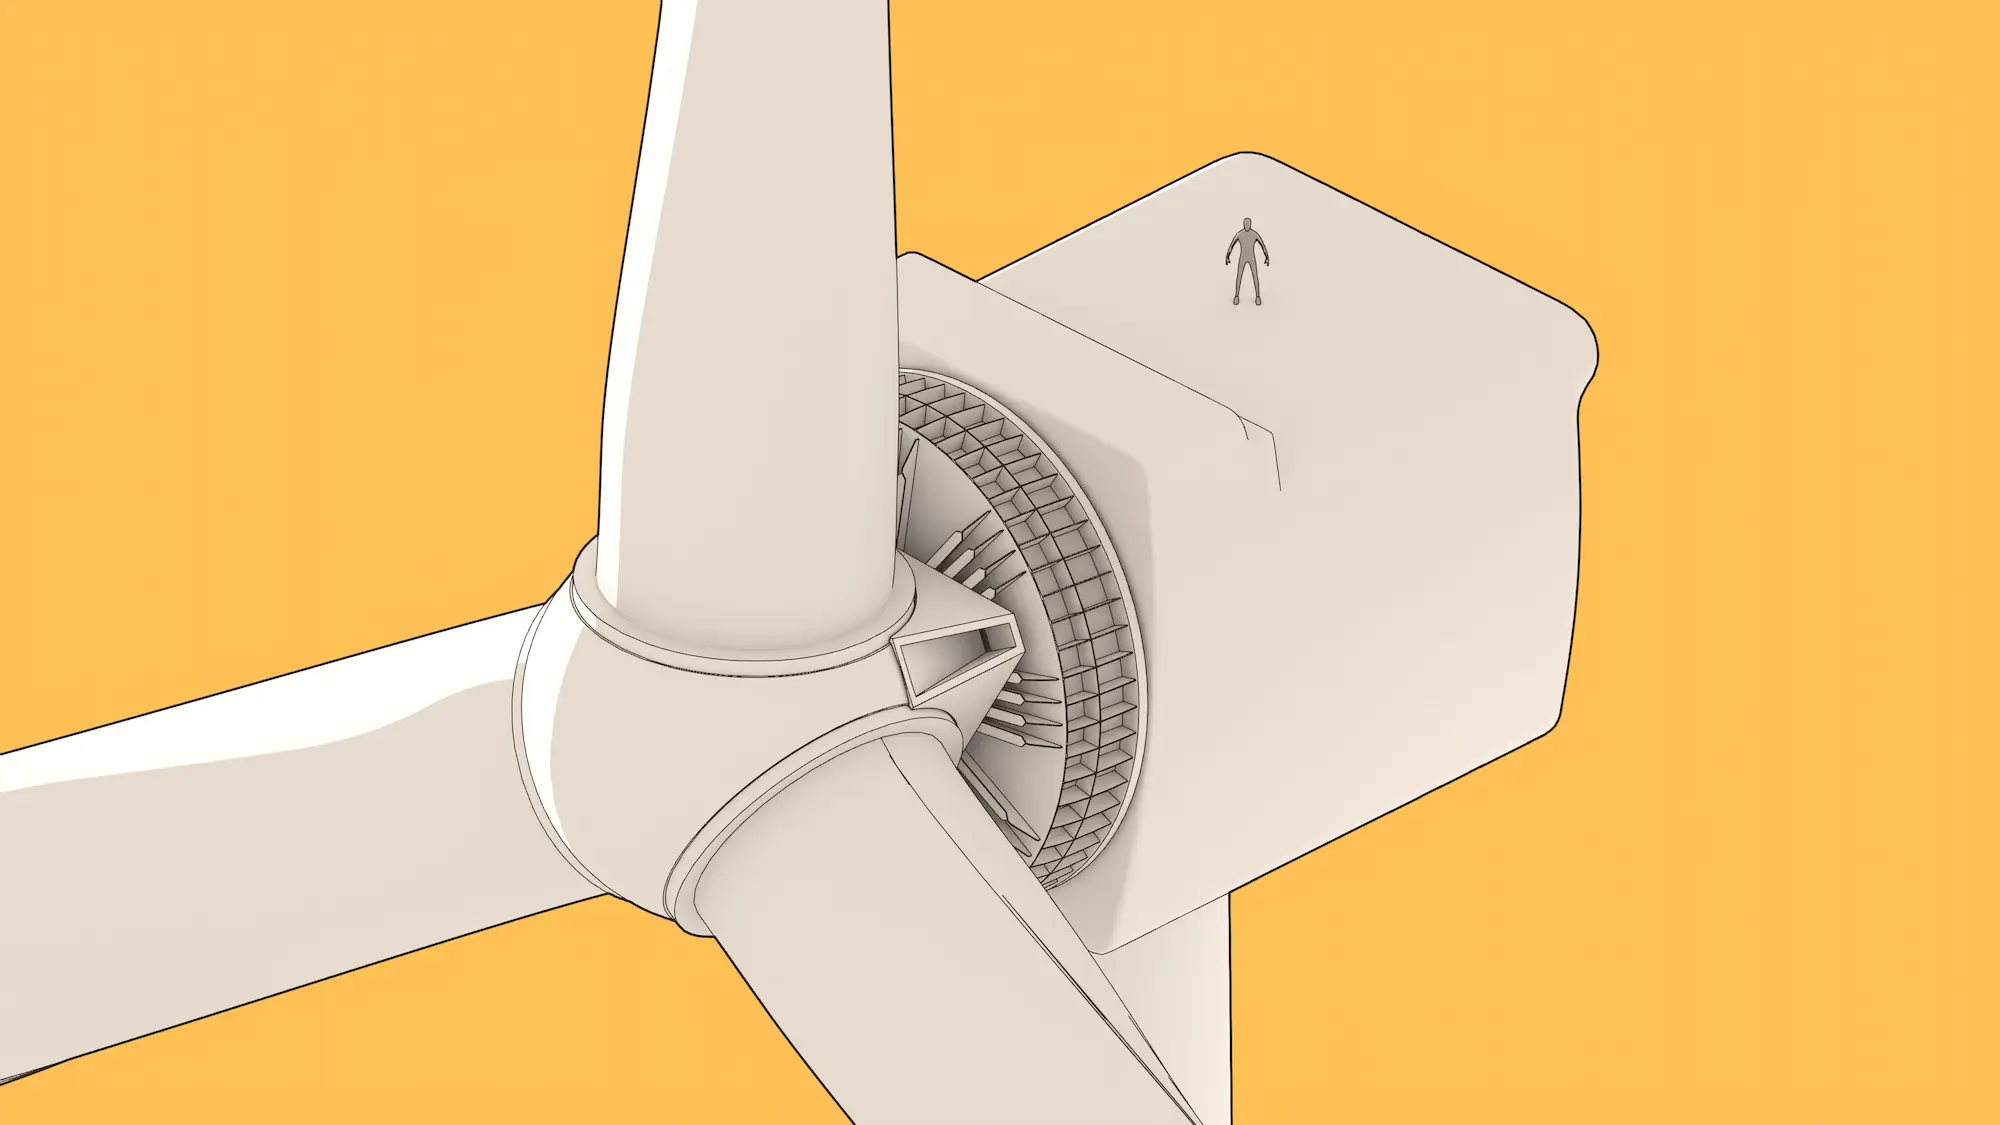
It’s been a really fun experience and has taught me a lot about 3D modelling. I also fell down some fascinating rabbit holes, like how to model an accurate turbine blade which required learning in detail how blades are designed.
Why? I’ve actually no idea. I just wanted to learn how to do it and it’s been nice to work on something that didn’t require any programming for a change.
Wind particle animations in Blender using Geometry Nodes
I’ve also been experimenting with using Blender’s Geometry Nodes to create wind particle animations. This is a type of visualisation that I’m using on the Renewables Map via WeatherLayers and I wanted to learn how to do it myself using a completely different application.
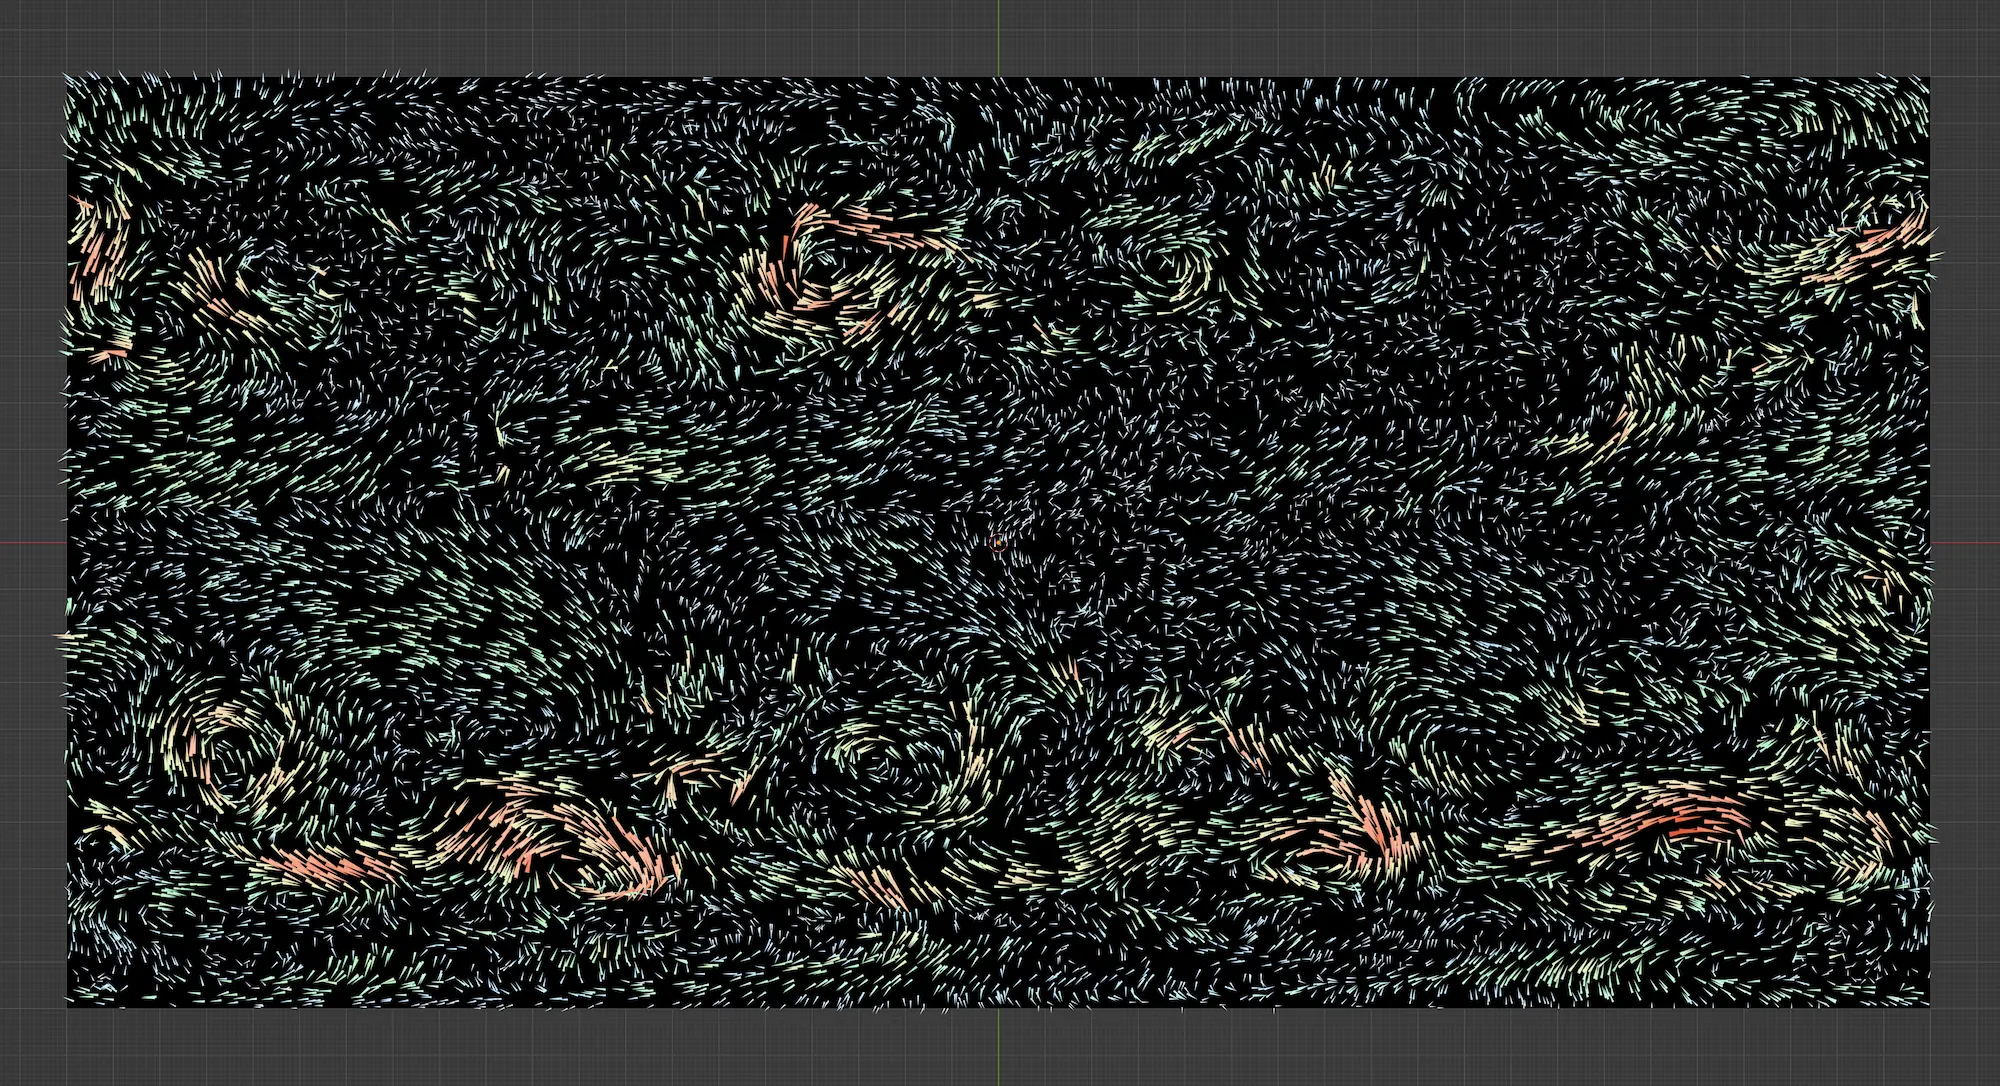
It actually turned out to be a lot easier than I expected and I was able to create a realistic wind particle animation in just a few hours. Though it’d be amiss if I didn’t credit WeatherLayers for doing all the hard work of packing wind speed and direction data into an image file.
I’d like to continue exploring this technique and see if I can combine it with other data inside of Blender to create more complex visualisations.
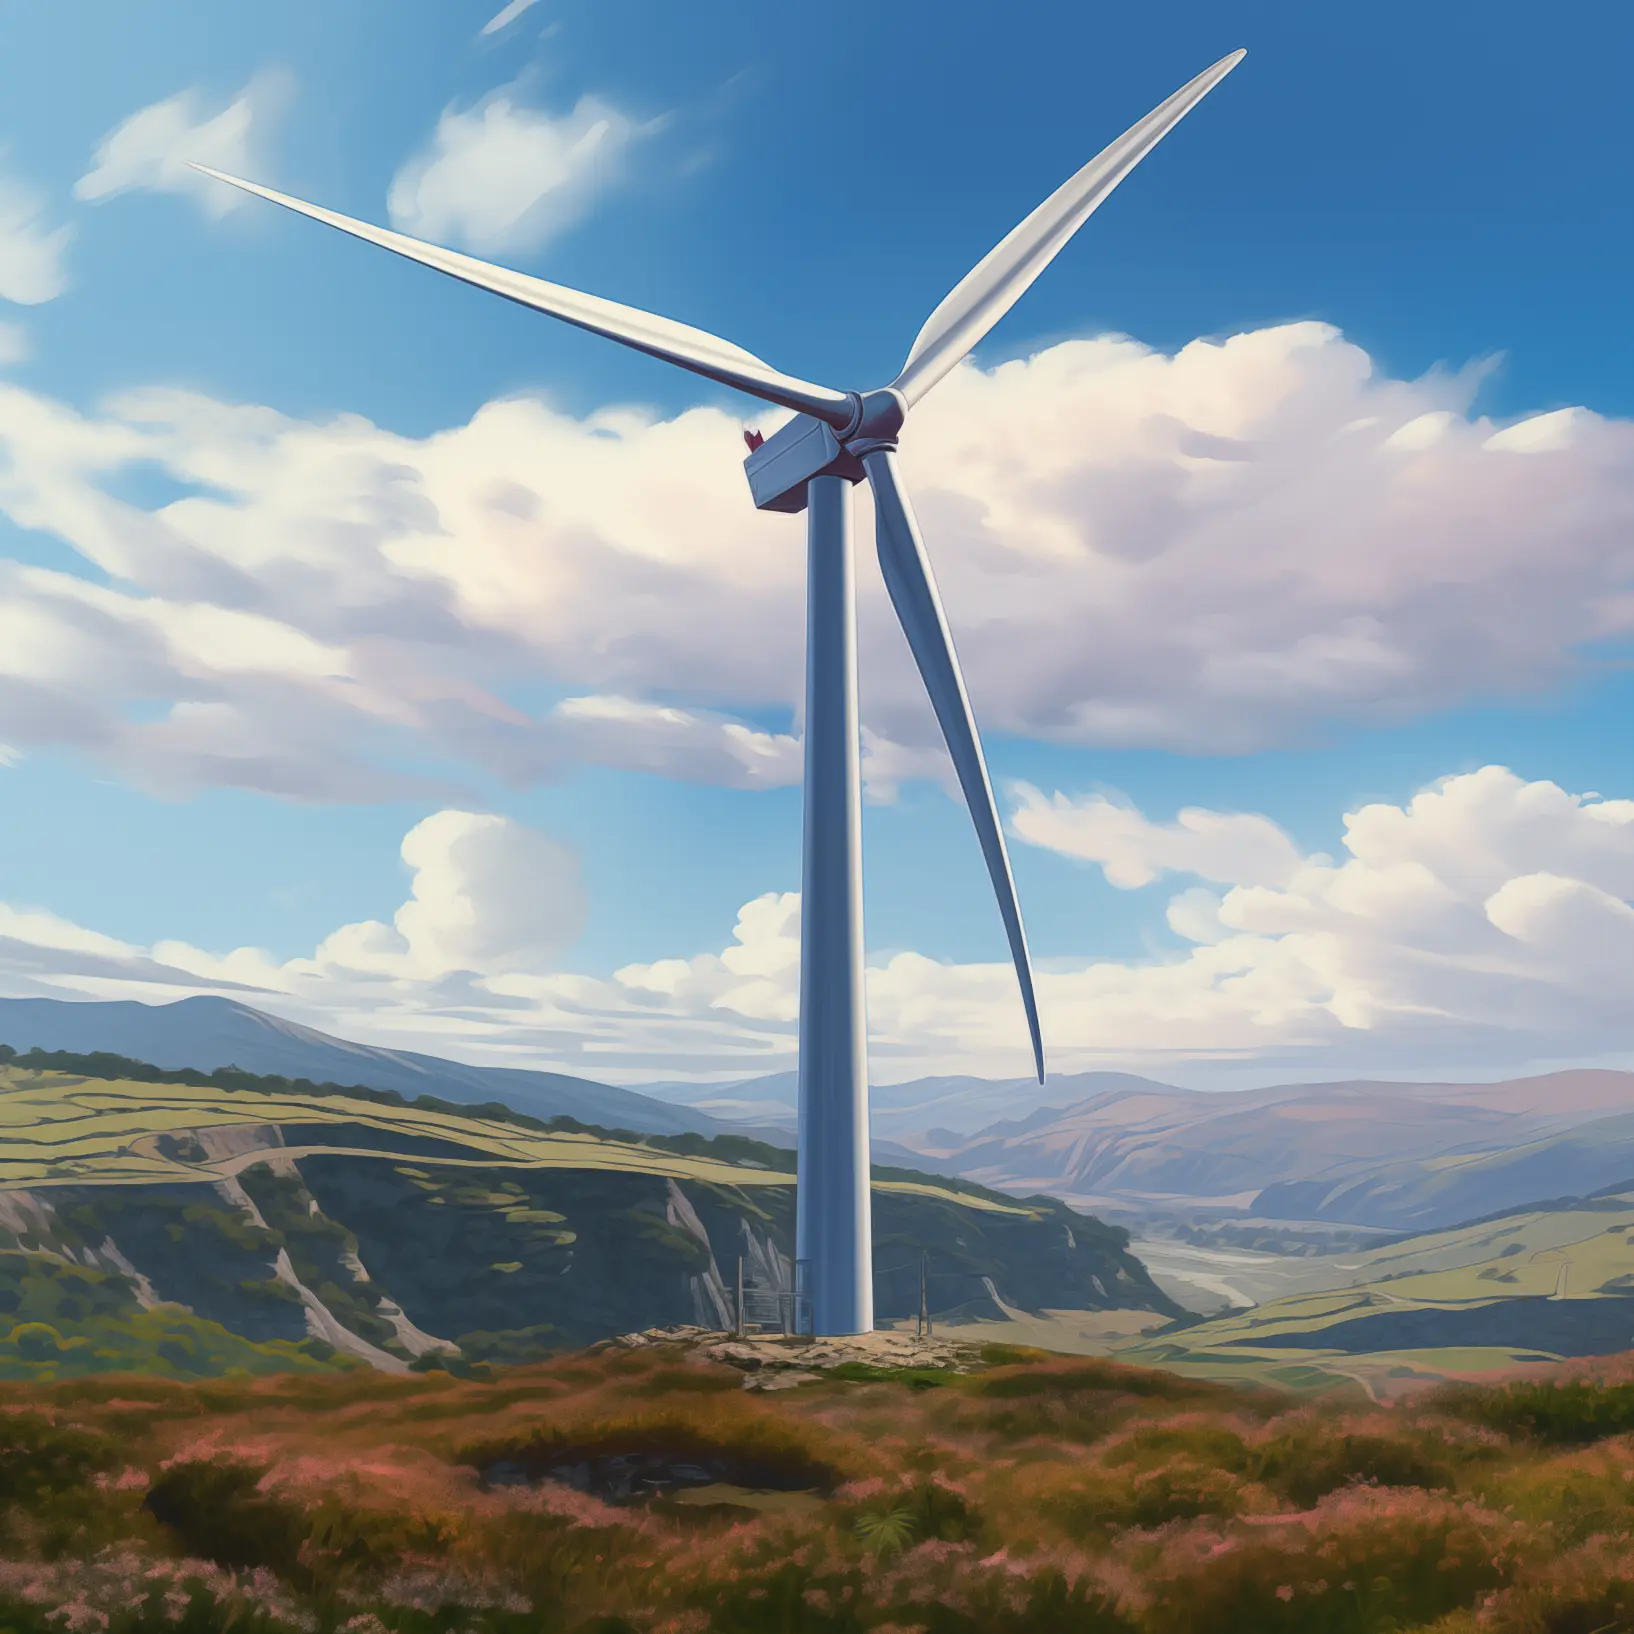
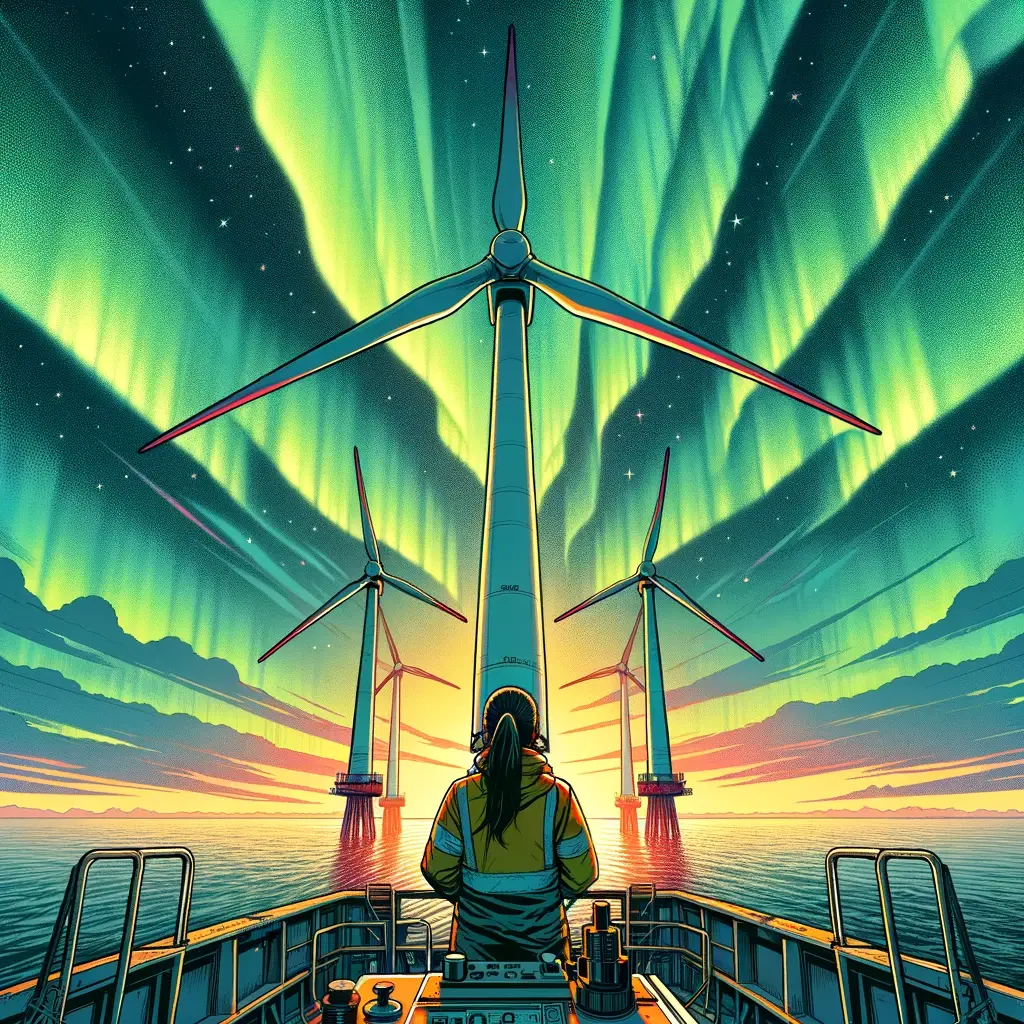
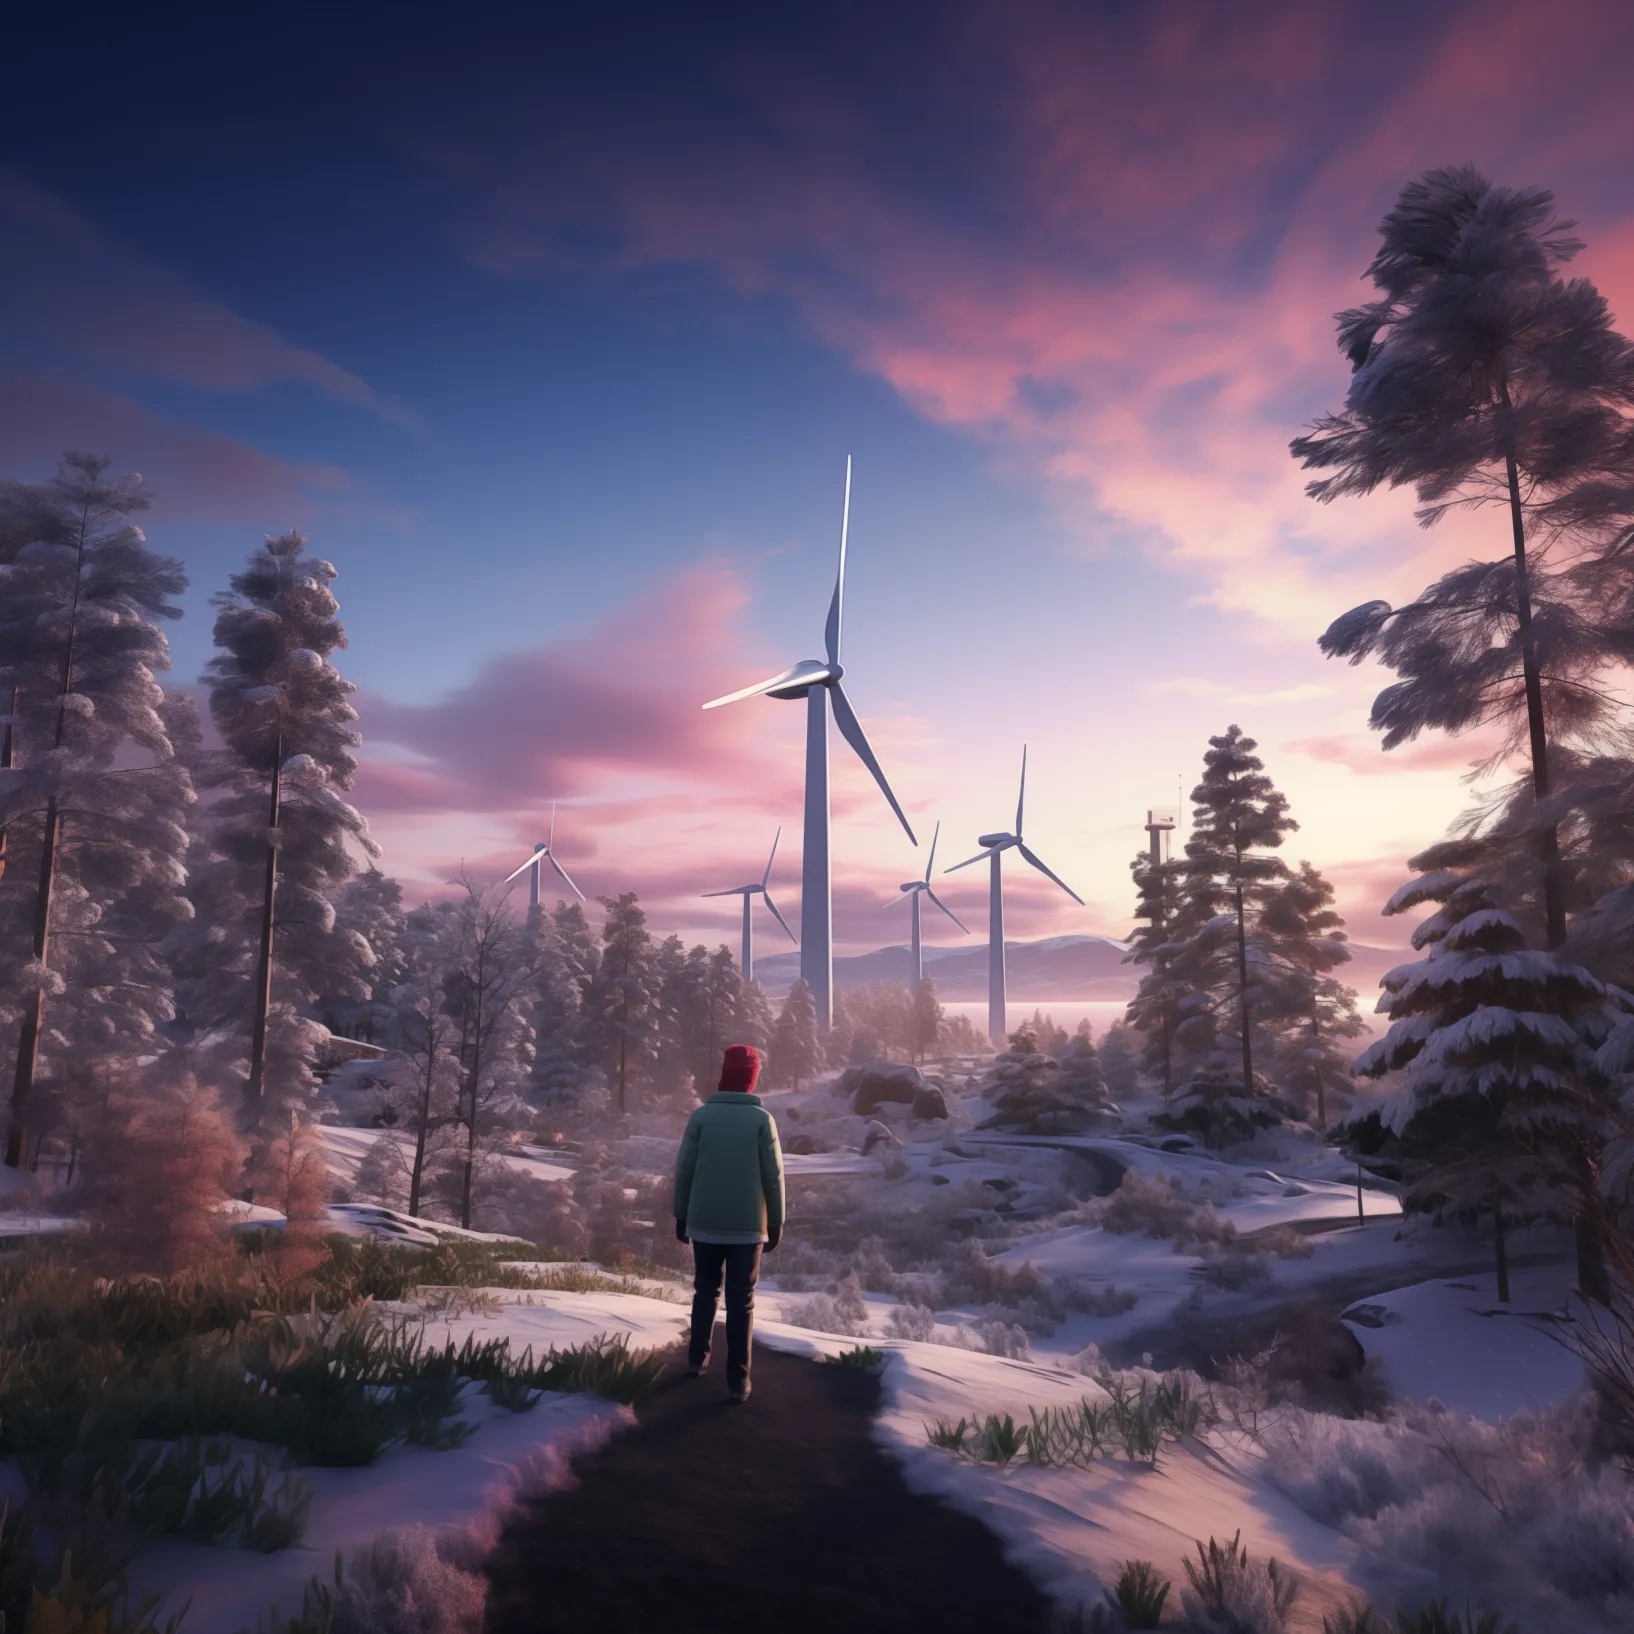
Exploring image generation using AI
Something different that I’ve been experimenting with is using AI to generate images of – you guessed it – wind turbines. Previous attempts at this last year were pretty terrible but I’ve been pleasantly surprised with the results this year using the latest versions of Midjourney and DALL•E.
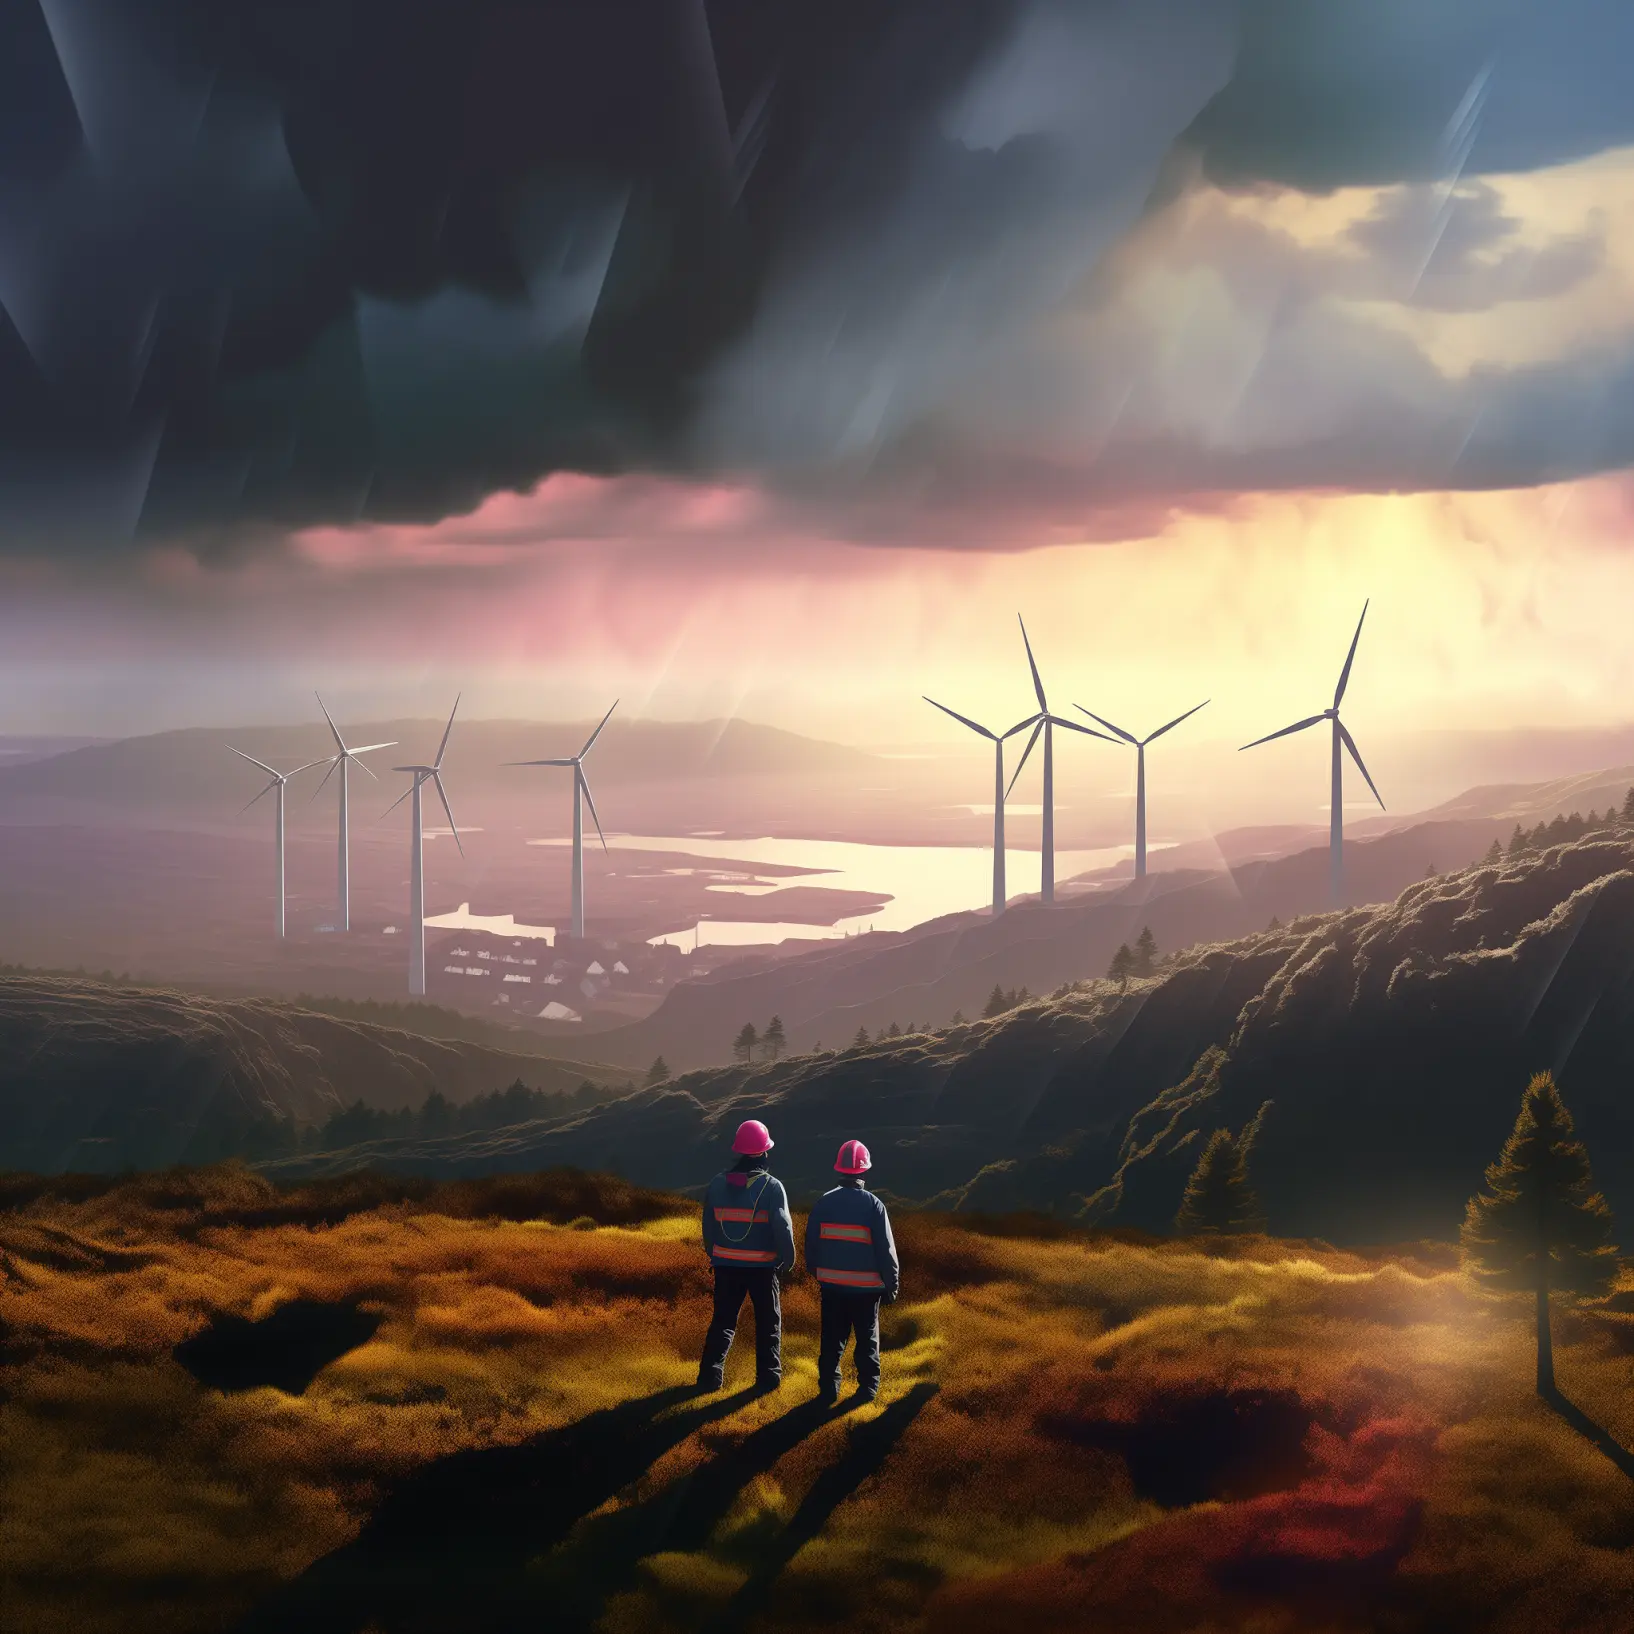
I’ve also been curious to see how far I can push the visual style to replicate the look of vintage illustrations from the 1950s and 1960s – an era of art, science and retrofuturism that I’ve been fascinated by ever since I read The Eagle Book of Cutaways as a kid.
It’s safe to say that the results so far have been pretty impressive, and the outtakes have been hilarious too.
Other things I got up to
Here are a few more things that happened this year and don’t really fit into any of the other categories.
Feeling nostalgic as ViziCities celebrates its 10th birthday
ViziCities turned 10 years old this year, which is kinda crazy. It feels like a lifetime ago when I started the project that would go on to define the direction of my career for the following decade.
I do miss working on ViziCities but there’s not really much need for it nowadays given the options available for 3D spatial visualisation. We’re now spoilt for choice with technologies like Mapbox GL JS, Deck.gl, Cesium, Blender and Unreal Engine to name a few.
Falling even deeper in love with DuckDB for data processing
I mentioned DuckDB in last year’s retrospective and I’ve been using it even more this year. I’m reaching for it in nearly all my data processing tasks now as it’s incredibly fast, easy to use and saves writing a bunch of Python code.
I’m particularly excited to try out the new-ish spatial features which will mean I can use DuckDB for various spatial data processing tasks, saving further time and effort.
This year also saw the release of the hosted version of DuckDB provided by MotherDuck. I haven’t had a chance to properly try it out yet but I have a feeling it’s going to make my life even easier.
Making a consistent espresso
You might be getting deja vu as I also talked about this in last year’s update. While last year was about getting better at making a decent espresso, this year was about repeatability and consistency.
![Grind distribution tool [Image: Amazon]](/content/images/2023/12/espresso-tool.webp)
The biggest changes this year were the addition of scales to ensure the same weight of grinds each time, as well as using a grind distribution tool to get rid of clumps in the basket. Together this has made every single coffee nearly identical in taste as most aspects of pouring an espresso are measured by me or controlled by the machine.
I’m still using the awesome Sage Bambino Plus espresso machine and have no complaints about it for the level of coffee that I’m after. Plus it’s nice and compact which means it doesn’t take much room in the kitchen. I’m also not using a grinder as I’m happy using pre-ground coffee to save time and mess.
Migrating this website to Astro
If you’ve visited my website before than you might notice that it looks a little different. That’s because I recently migrated it to Astro and also took the opportunity to redesign and simplify things a bit.
Why Astro? No particular reason aside from wanting to try it out and see what it’s like. I’ve been using Next.js a lot for other projects and while it’s great, I wanted to try something different this time.
Another big reason was that I want to create highly-customised content on this website (maps, charts, etc) and this wasn’t really possible using the previous stack. By migrating to Astro I can now make full use of MDX to mix Markdown and custom React components together. Very cool.
Personal life
Let’s switch gears and talk about my personal life.
While life is generally good and in some ways I’ve never been happier, it’s clear that I have a bunch of stuff to sort out and improve on for next year.
This section may seem like a cry for help but I’m OK. I find it beneficial to be open and frank about these topics, which allows me to be honest with myself as I figure out what I need to do to be happier and healthier.
Why share it in public? Well, partly for my own benefit as it’s a good way to reflect on things and hold myself accountable. But also because I know that I’m not alone in feeling this way and I hope that by sharing my experience it might help others in similar situations.
Catching covid for the first time
Somehow I managed to avoid catching covid for three and a half years, despite El having it a while ago and us not really trying to isolate from each other. I was genuinely starting to wonder if I had some sort of immunity.
Well, it finally got to me this September and it sucked – it was by far the worst illness I’ve ever had. It was like the worst flu immediately followed by the worst head cold and it went on like that for a good 10 days.
I was completely wiped out and spent most of the time in bed as I had no energy to do anything else. In a way that was the worst part as I was bored out of my mind but couldn’t do anything about it. It was also frustrating as I happened to have taken two weeks off work for a break and then immediately got ill so spent the entire time feeling like crap.
Neglecting physical and mental health
I’ll be honest admit that I’ve been neglecting both my physical and mental health this year. I was going to say that I’ve been so focussed on work and side projects that I’ve let everything else slip, but that’s not really true.
The reality is that focussing on work and side projects is a coping mechanism for me. It’s a way to distract myself from the things that I’m struggling with and don’t want to face. It’s a symptom, not the cause.
I’ve tried getting into a gym routine this year and I had a period of success, but it didn’t last. I’ve also been trying to eat better but that also failed because I get little enjoyment from cooking nor from food in general.
I also feel like my brain is at full capacity with nothing spare, as if I’m a bucket full of water and adding anything new will simply pour out over the edge. Though that isn’t new, it’s sort of my default state and it’s tightly connected with my inaction which I talk about in the next section.
The elephant in the room is that I’ve been wanting to seek an ADHD diagnosis for years but keep putting it off. I’m not sure why, I think it’s partly fear of being wrong about it but also a fear of having to do something about it should I be diagnosed. Either way something has been up with me since childhood and I’d love to know what it is.
This all sounds rather dreary but I’m actually feeling pretty good about it all. Awareness and acceptance is half the battle, I just need to do something about it now. And if not for me, then for those close to me.
Letting life slip by through inaction
Another wake up call this year is realising that I’m letting life slip by through fear and inaction. I’ve always been prone to over-thinking and deferring things, but it’s getting worse and I’m letting it get in the way of doing the things I really want to do in life.
The fear of making a decision and something going wrong is irrational and exhausting – I refer to this as catastrophising and it’s my modus operandi. I’m also pretty bad at over-thinking potential consequences of decisions and actions that are fluffy and abstract – basically anything that involves people rather than systems and code – so I avoid making those decisions.
Interestingly this isn’t happening at work, only in my personal life – I think because at work I know what I’m doing and I can quantify the repercussions of my actions (eg. code either works or it doesn’t). I imagine it’s also partly because at work I can get involved and resolve things myself if needed, whereas in my personal life things can be completely out of my control.
Ultimately I’m letting life slip by as a result of this decision paralysis. And the pandemic has absolutely made this worse as it’s caused me to over-analyse things much more than I usually would.
As an example of how irrational this can be; both El and I want to travel more but the pandemic has made me overthink getting sick while travelling, or something going wrong with the house while we’re away, or some other concern outside of my control. So I keep putting it off and we go no where.
Now if I’m like that going on holiday, just imagine what I’m like making big life decisions such as buying a house or having kids (hint: not great).
Surely it’s better to do something, anything today and potentially get it wrong than to do nothing at all? Worst case I can learn from it and try again, best case nothing goes wrong and I get to enjoy the benefits. I know and understand this, and yet I still struggle massively with it 🥲
I’m not getting any younger and I don’t want to look back on life and regret having not done something because I was afraid of unlikely consequences. It’s not good for me and it’s not good for those around me.
Losing control of personal communication
I’ve completely lost control of personal communication this year, likely as a result of all the other things I’ve mentioned. I’ve always been bad at replying to messages but this year it’s been worse than ever.
Part of this is related to hyperfocus and going off the radar for days or weeks at a time but it’s also because the more active I am on social media the more messages I get. Don’t get me wrong, I love talking with others from the community but eventually I can’t keep up with the messages so I stop replying to any of them and they build up even more.
I’m not sure what the solution is but I’m coming to terms with the fact that something has to give and I’m never going to reach “inbox zero.”
Ditching Twitter for LinkedIn
Talking about being more active on social media, I’ve been using LinkedIn much more this year and have been pleasantly surprised with the results.
For pretty much my entire professional career I’ve been using Twitter as my main social media platform, but it’s been dying a slow death for a while now. I’ve also been getting increasingly frustrated with the decreasing amount and quality of engagement on there.
On the other hand, LinkedIn has been thriving and I’ve been getting a lot more engagement with interesting and relevant conversation. I’ve also been enjoying the content that others are posting and it’s been a great way to connect with people in the energy industry.
I genuinely can’t believe that in 2023 I’m saying that LinkedIn is my favourite social media platform, but here we are. Thanks Elon!
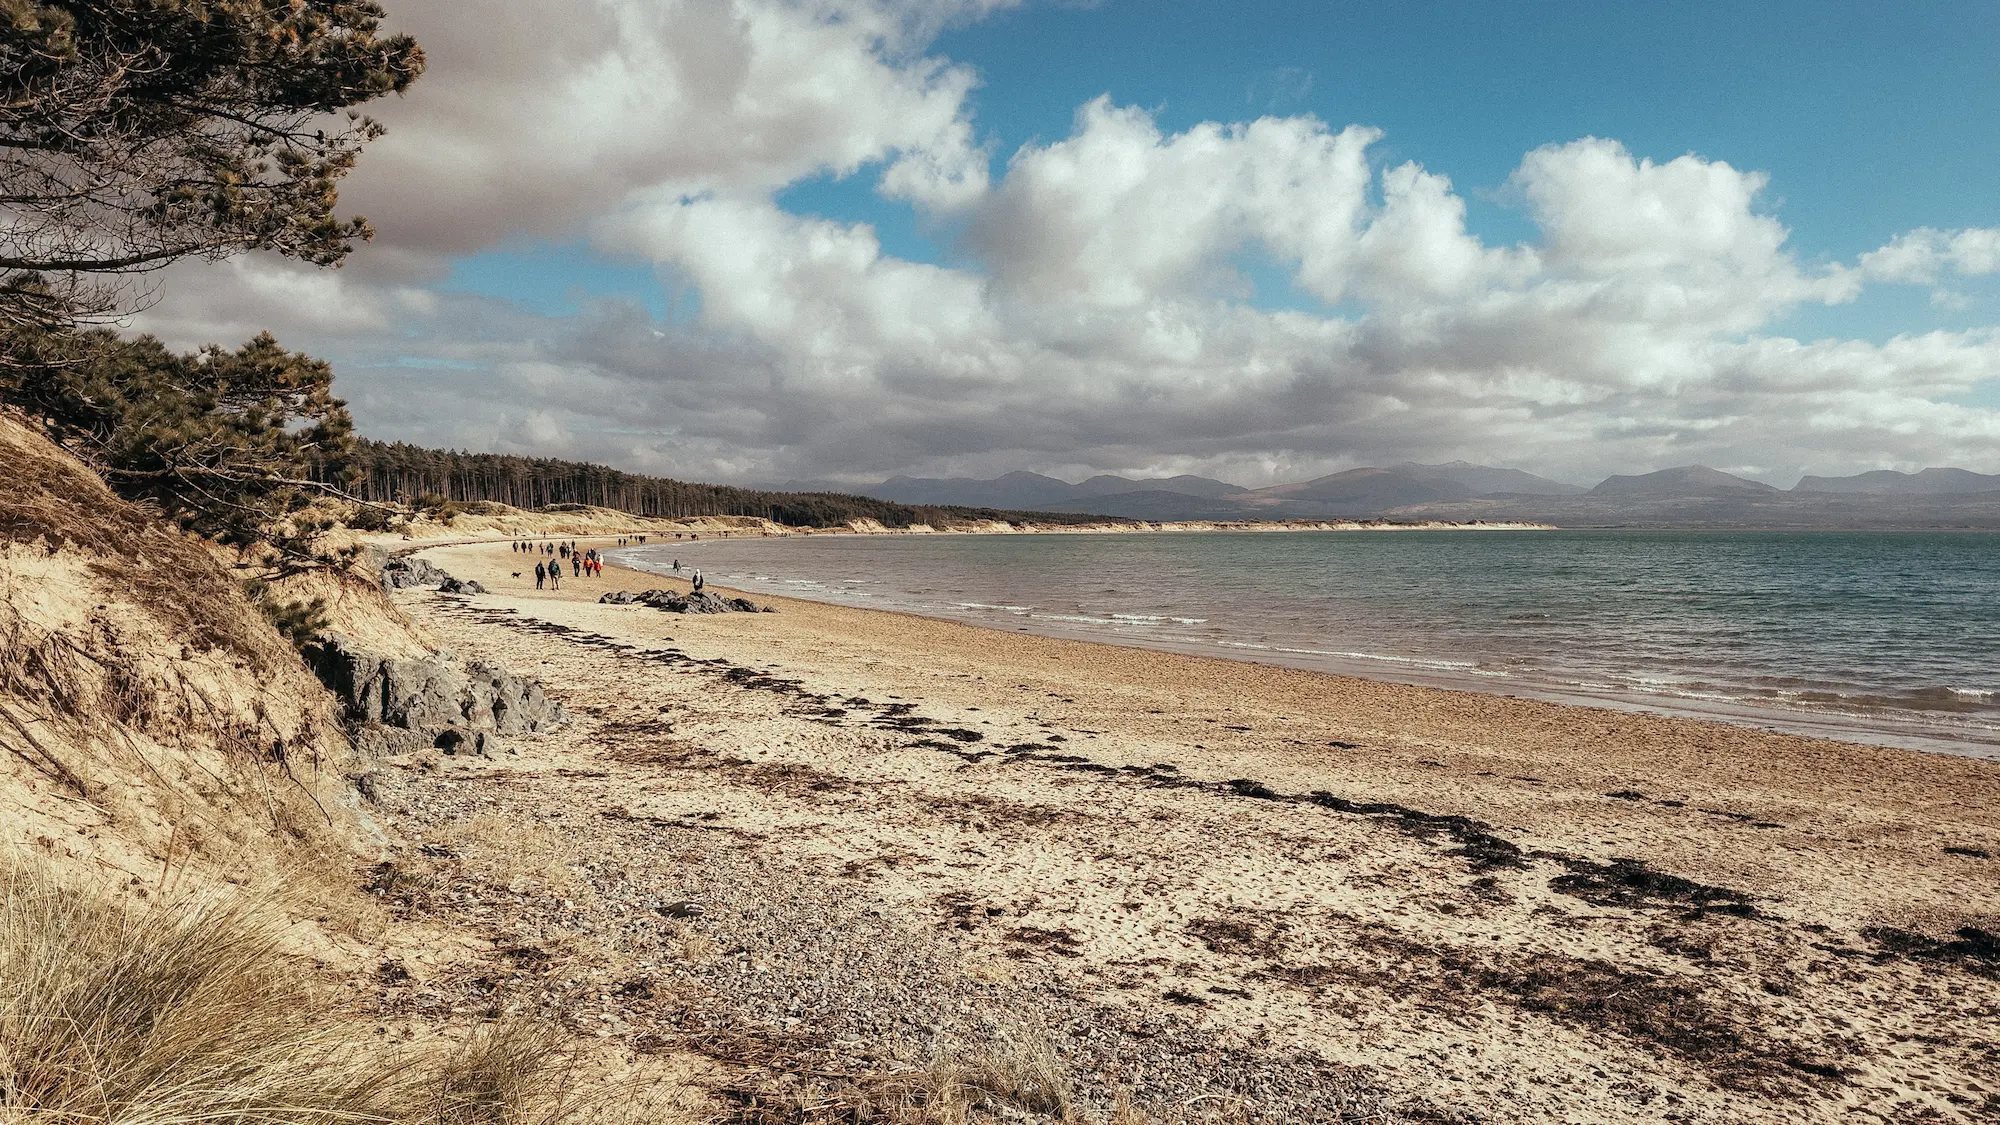
Travel and photography
So I didn’t take many photos this year, at least not compared to previous years. Not travelling anywhere of significance is part of the reason, but I also just didn’t feel like taking photos for most of the year.
I did take a few though, mostly on my phone rather than a big camera. I also bought a Fujifilm X-T5 later in the year to see how I get on with a smaller, lighter camera, though I’ve only used it once so far.

Reviewing my wishes for 2023
TL;DR; I didn’t do most of the things I wanted to do this year, especially in my personal life. But that’s OK, I’m not going to beat myself up about it.
Things I did
- Continue immersing myself in the energy transition and learning more
- Write more on the blog,
at least starting a “today I learnt” (TIL) series - Work on a series of visualisations around understanding the electricity grid and technologies related to the energy transition
Things I attempted
- Look after my body better, even if just getting into a routine of working out
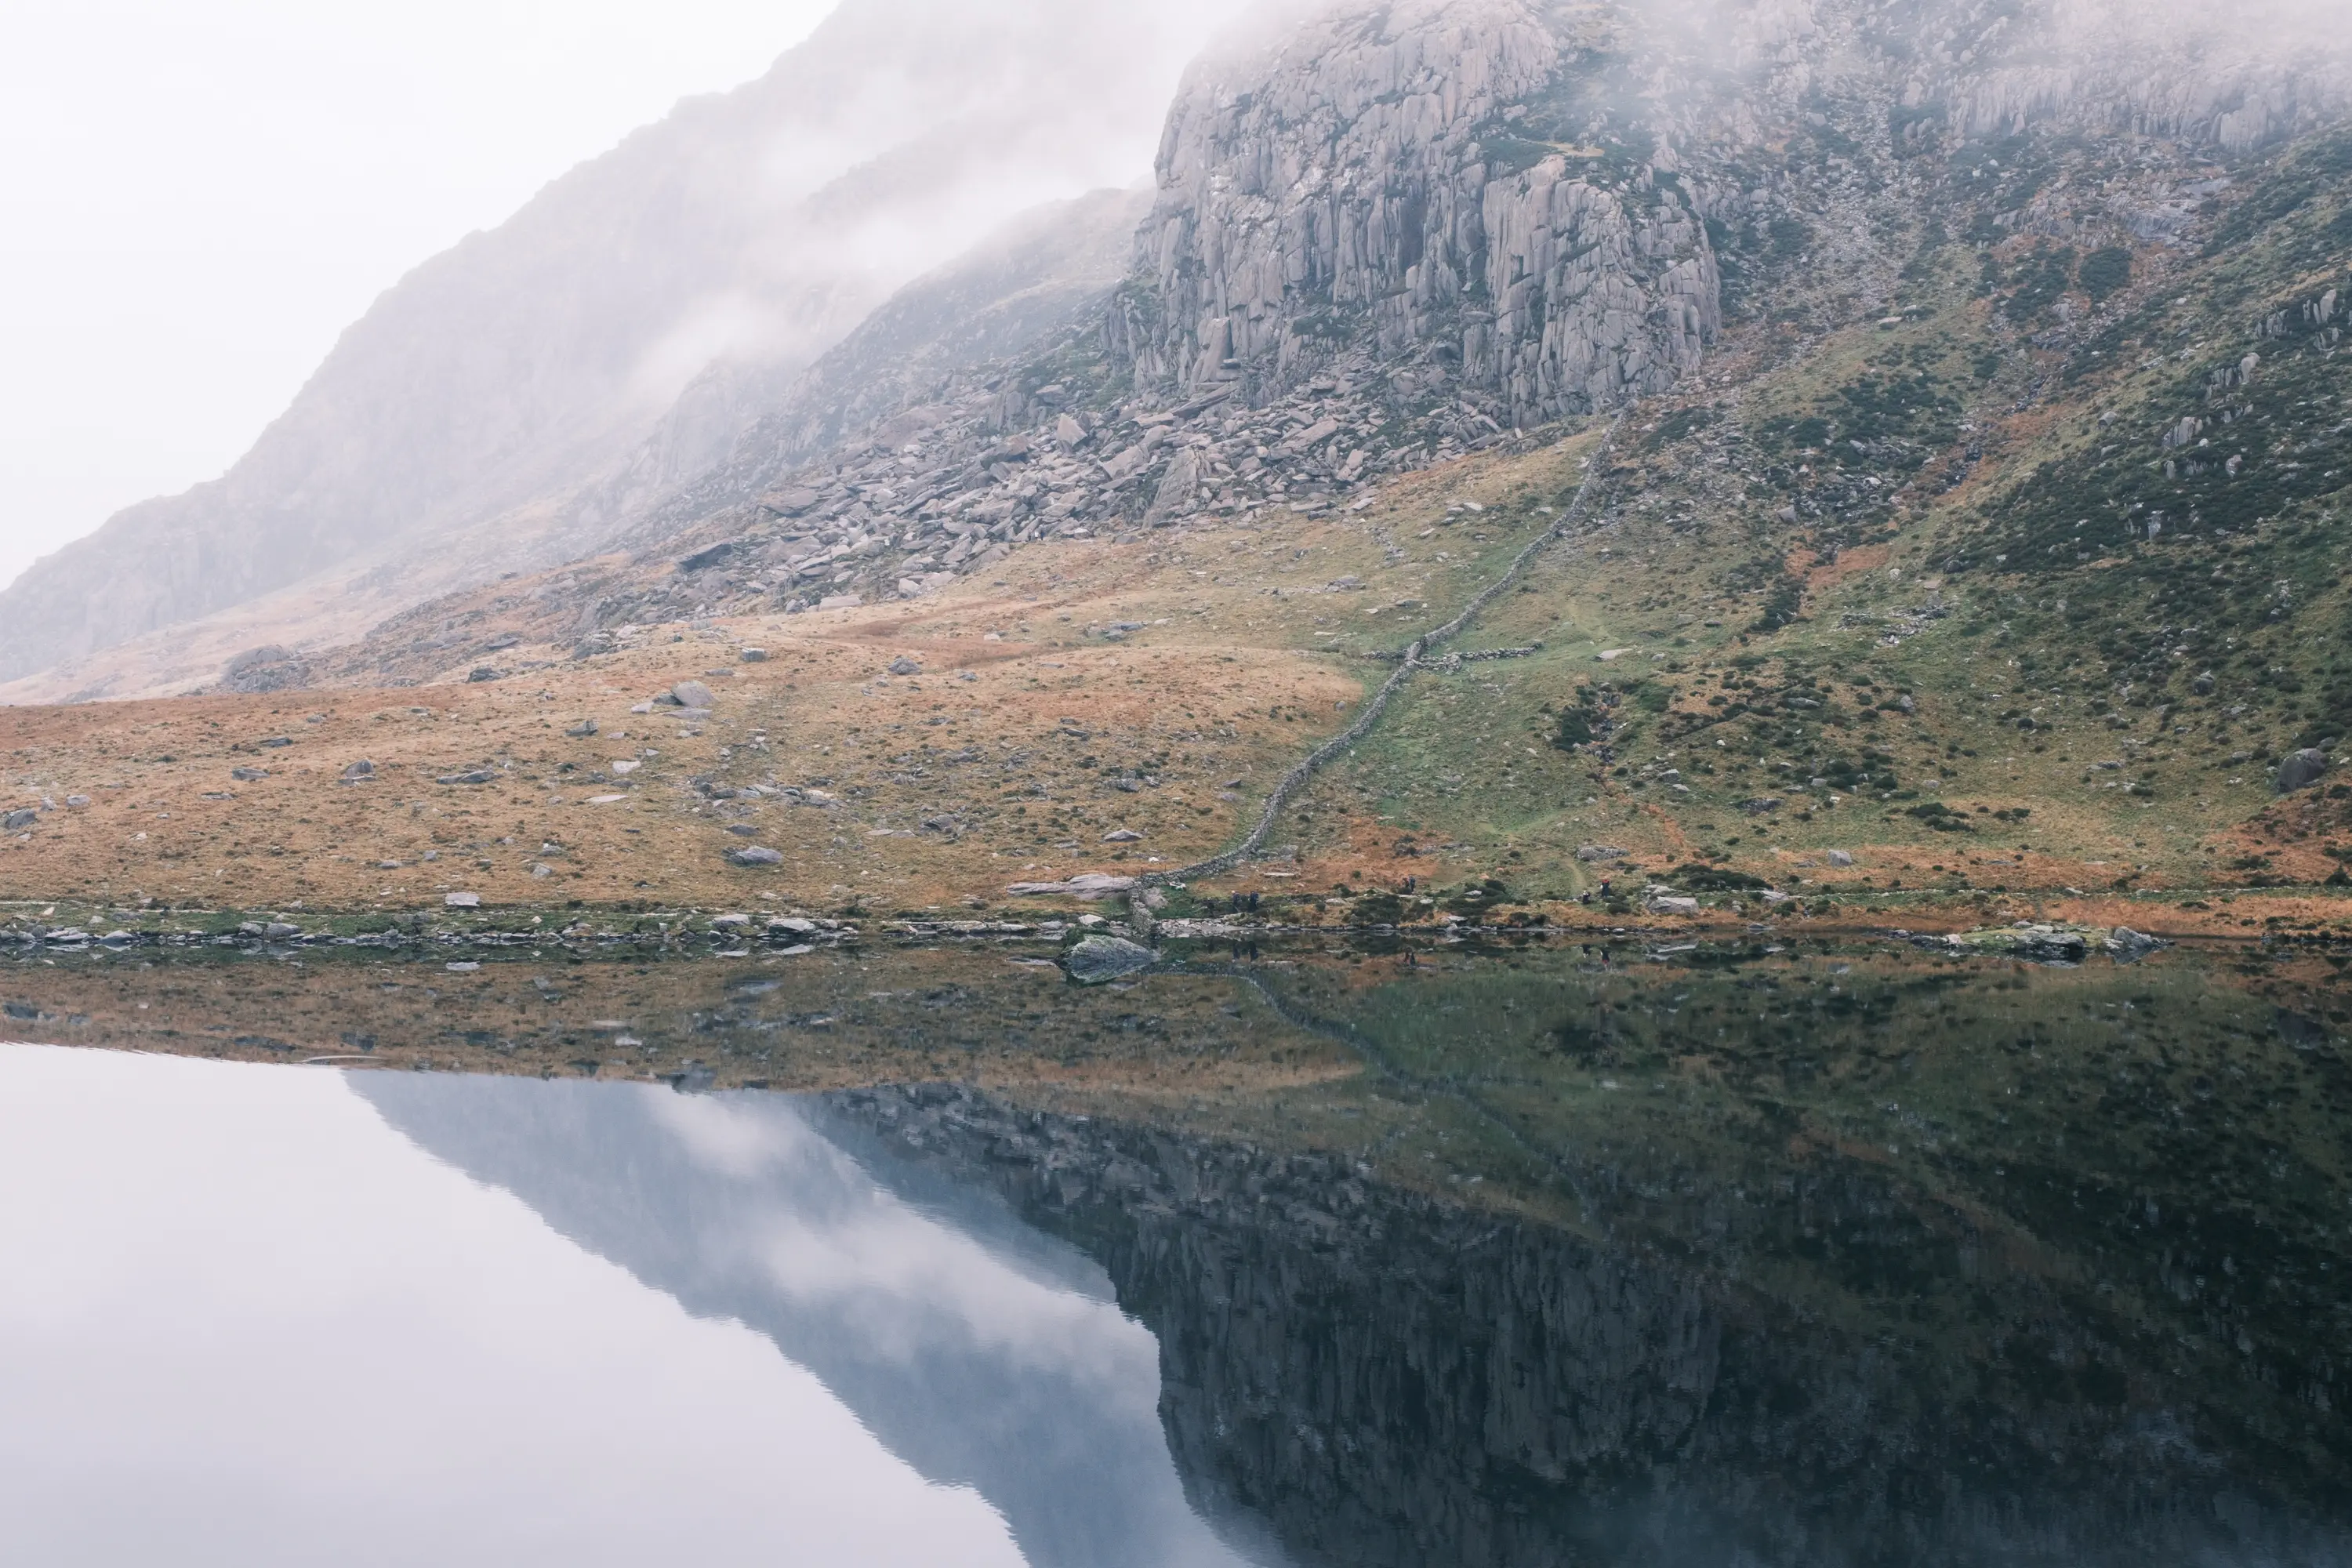
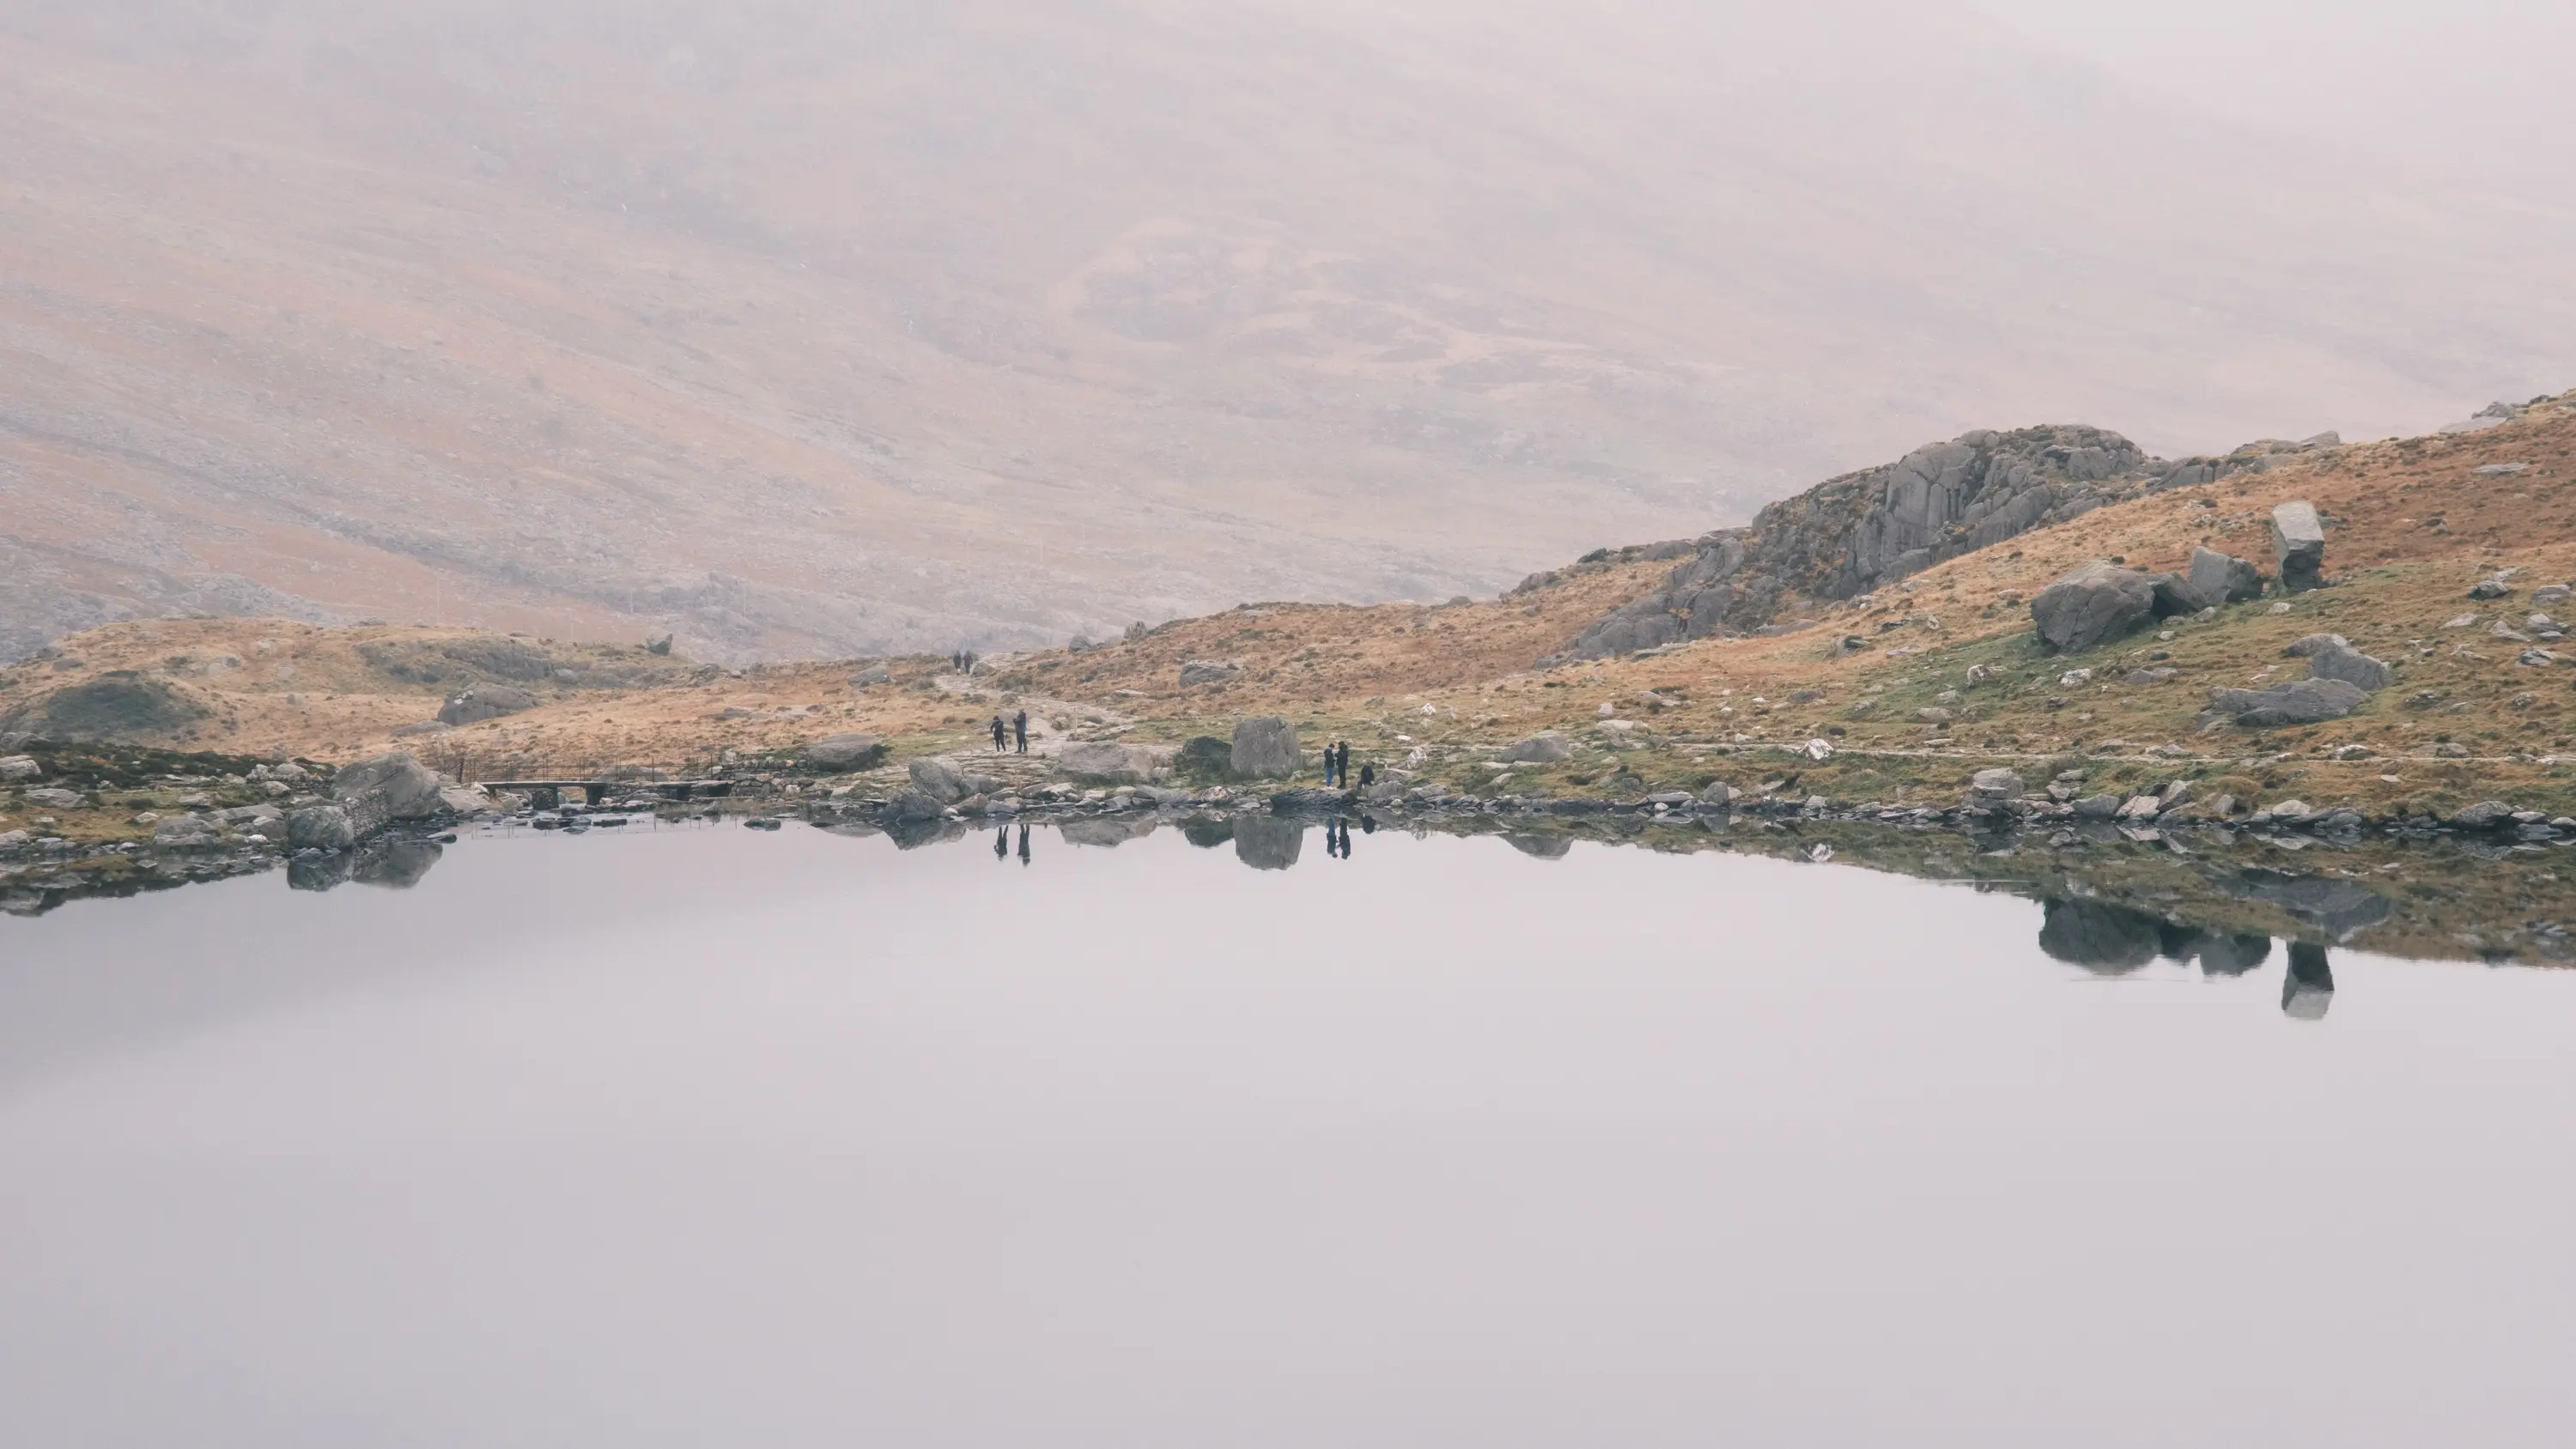
- Get out to Eryri more often
Things I didn’t do
- Actually put some of my photos up around the house
- Make my home office cosy and practical, and a bit less bland and clinical
- Continue rightsizing my possessions and getting rid of anything I no longer use
- Read more books, especially on subjects I’m interested in
- Foster an environment at home that gets me away from the computer without feeling like I’m stopping myself from doing the things I want
Wishes for 2024
As always I have a bunch of things I want to achieve in the coming year.
I avoid calling them goals as that’s unnecessary pressure and I shouldn’t feel bad if I don’t “complete” them. I like to instead think of them as wishes, things I want to do more of and things I want to do less of.
Work and professional life
- Generally happy and want to continue doing what I’m doing
- Continue immersing myself in energy data and renewable energy
- Continue using LinkedIn to share my work and engage with others
Personal projects
- Focus on one or two personal projects and tasks at a time – be OK parking the rest for now
- Set goals for what I want to achieve with each project and task and use them to focus my efforts
Personal life
- Find methods to make decisions and be OK with the consequences
- Find methods to be better at replying to messages
- Start the process for diagnosing ADHD or whatever’s going on with me
- Get back into a regular, realistic gym routine
- Pull myself away from the computer more often
- Do at least one “big trip” abroad that’s been on our list and accept it’s going to be stressful, probably not perfect, but ultimately worth it
- Visit Eryri more often, regardless of the photography
See you next year
All in all, 2023 was a pretty good year. I’m happy with what I achieved at work and with my personal projects, and I’m glad to be aware of and motivated to tackle the things I need to work on in my personal life.
Reading this post back to myself it’s no wonder that I’ve been feeling a little exhausted lately – turns out a lot has happened!
What about you? If you haven’t already then I highly recommend sitting down and listing out your own achievements over the past year, and what your wishes are for the next. It’s quite therapeutic and I bet you’ll be surprised at how much you actually did.
Nadolig Llawen a Blwyddyn Newydd Dda! 🏴
Merry Christmas and a Happy New Year!