2022 Retrospective
Rounding up the past year of my life and taking a look at what's coming next.
It’s that time again where I try to remember all the things that happened the past year. What went well, what didn’t go well, and what I want to do more of.
This year has been absolutely packed with life events and projects, both in and out of work. A bit of travel, loads of photography and a lot of learning in between.
So let’s get started…
Joining the Octopus Energy Group
This year started with me joining Kraken Technologies (part of the Octopus Energy Group) to work on visualisation within the consumer and renewable energy sectors.
It’s by far the biggest and most notable life event this year, at least in terms of my career and personal happiness. It’s also easily my favourite role of my career to date, and that’s saying something.
Working here has had a hugely positive influence on my motivation and sense of purpose, both areas that I mentioned struggling with in last year’s update. I still have to pinch myself that I not only get to do work that I thoroughly enjoy, but that I also get to apply it to something that is incredibly important to all of us – the transition to renewable energy. I feel truly energised, if you can excuse the pun.
I could talk endlessly about all the things I love about working here, so here’s an attempt to summarise what stands out most now I’m a year in:
- It feels like what you’re doing actually matters and is leaving the planet in a better place than when you started
- It’s clear that Octopus is a place where actions speak louder than words – do it, don’t just think it
- Move fast, innovate and iterate – this is why we’re so disruptive to the sector
- Remote working is baked into the structure of the group and isn’t an afterthought
- The company culture is fantastic and has been consistent from day one
- You are treated as an adult and trusted with generous flexibility and freedoms, like not counting your time off
- Everyone is so excited, invested and pulling in the same direction – something I haven’t experienced since my time at Mozilla
- There’s so much amazing and mind-blowing stuff going on all across the group, with new stuff being announced on a very regular basis
- Our weekly “Family Dinner” events are a favourite of mine and never fail to inspire me and give me an extra boost if I’ve been flagging – a perfect end to each week
Long story short, I’m going to savour this opportunity for as long as I’m able to.
And if any of this interests you, we’re hiring across a variety of roles worldwide so make sure to check out the careers page and see if anything stands out.
Things I’ve worked on
One positive result of my renewed motivation is that I’ve made so many things this year, both in and outside of my day job. I honestly can’t remember the last time I’ve felt this inspired, excited and impatient, and for it to be sustained (perhaps even grow!) throughout the entire year.
There are too many projects to cover in detail, so here’s a non-exhaustive list of the most notable things I’ve worked on this year – in no particular order.
What can I do with my house?
As soon as I joined Octopus I wanted to explore an idea for an interactive 3D experience that highlights energy-related technologies around the house. Specifically, I wanted something that answers the question of “what can I do with my house?” in terms of energy savings and the transition to a smarter, renewable electricity grid.
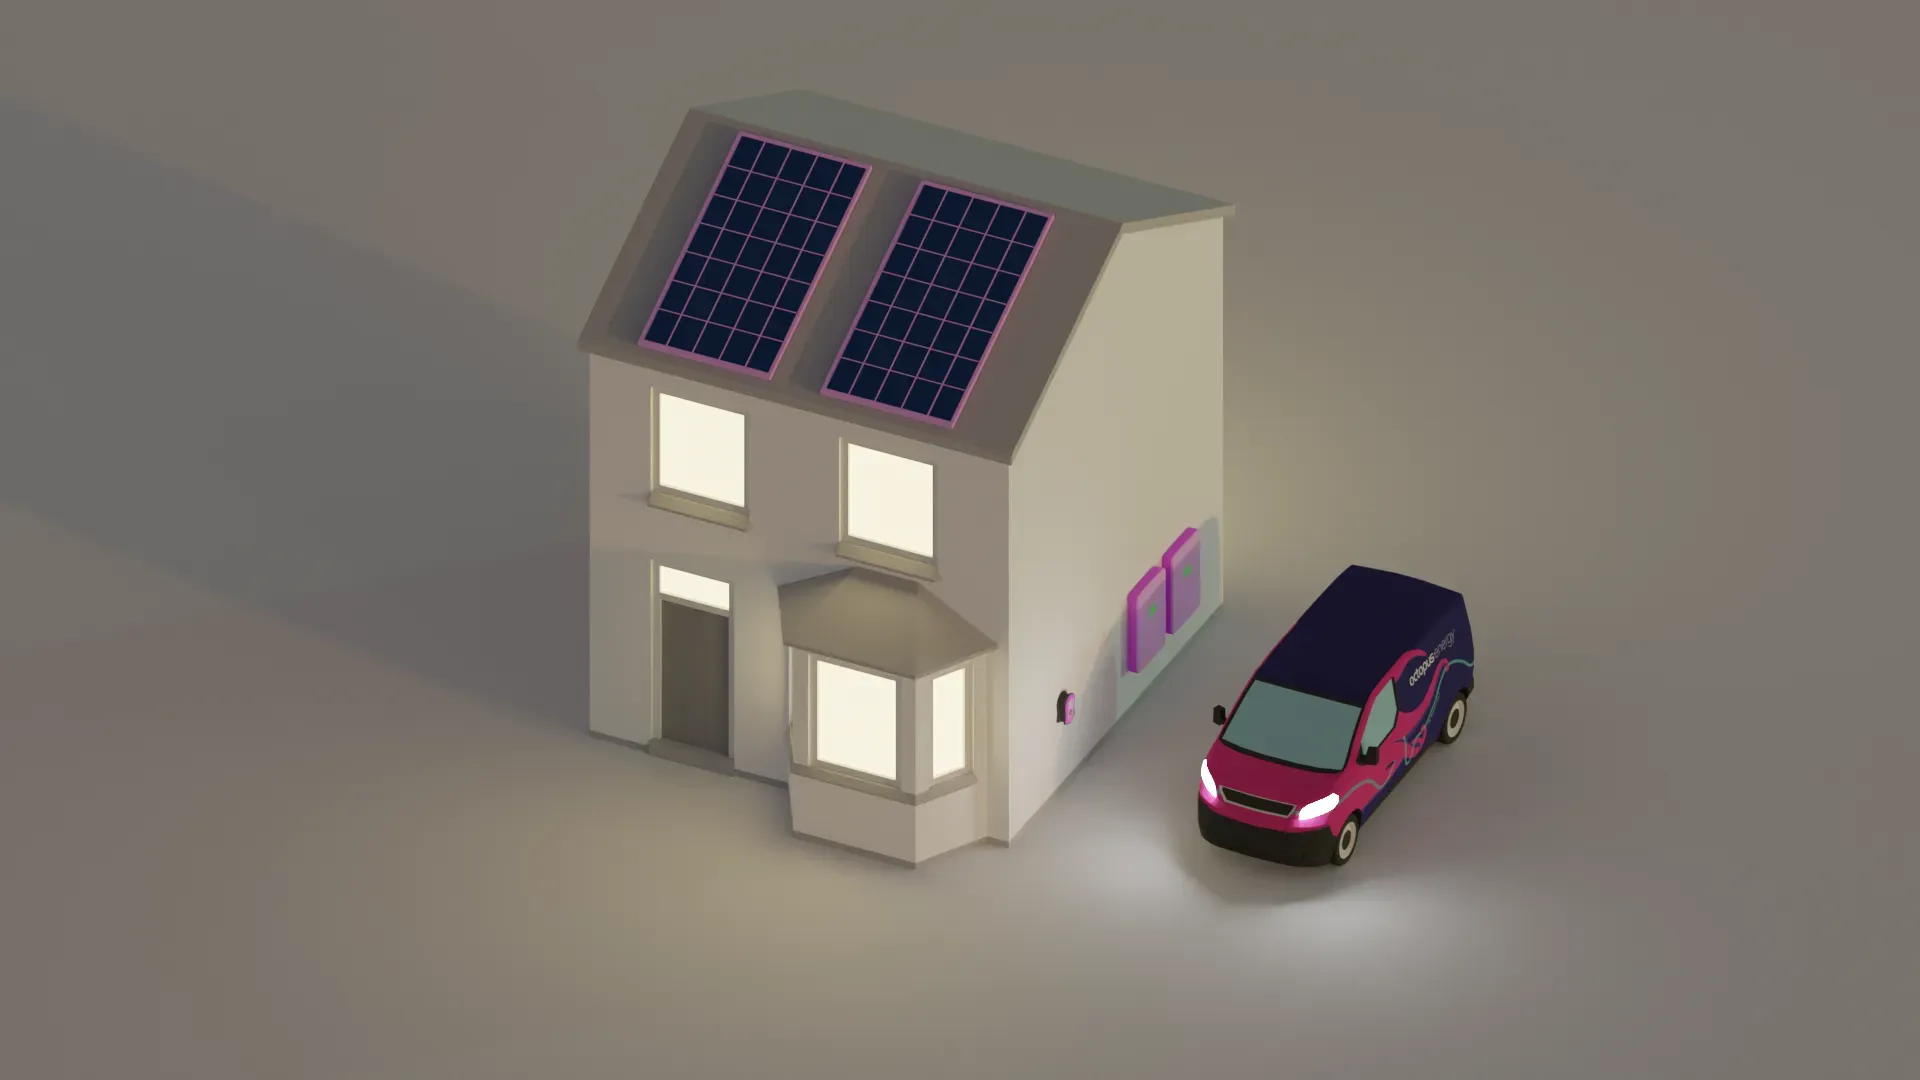
The first version was a simple 3D experience created using react-three-fiber and very basic models to represent a house, wind turbine, solar panels, etc. It did the job, though it wasn’t particularly pretty.
I wanted an excuse to learn more Blender so I took the opportunity to upgrade all the 3D models by recreating them in much higher detail. I learnt a lot and the results are far superior to the initial version. It really showed me how powerful Blender is and what it’s capable of.
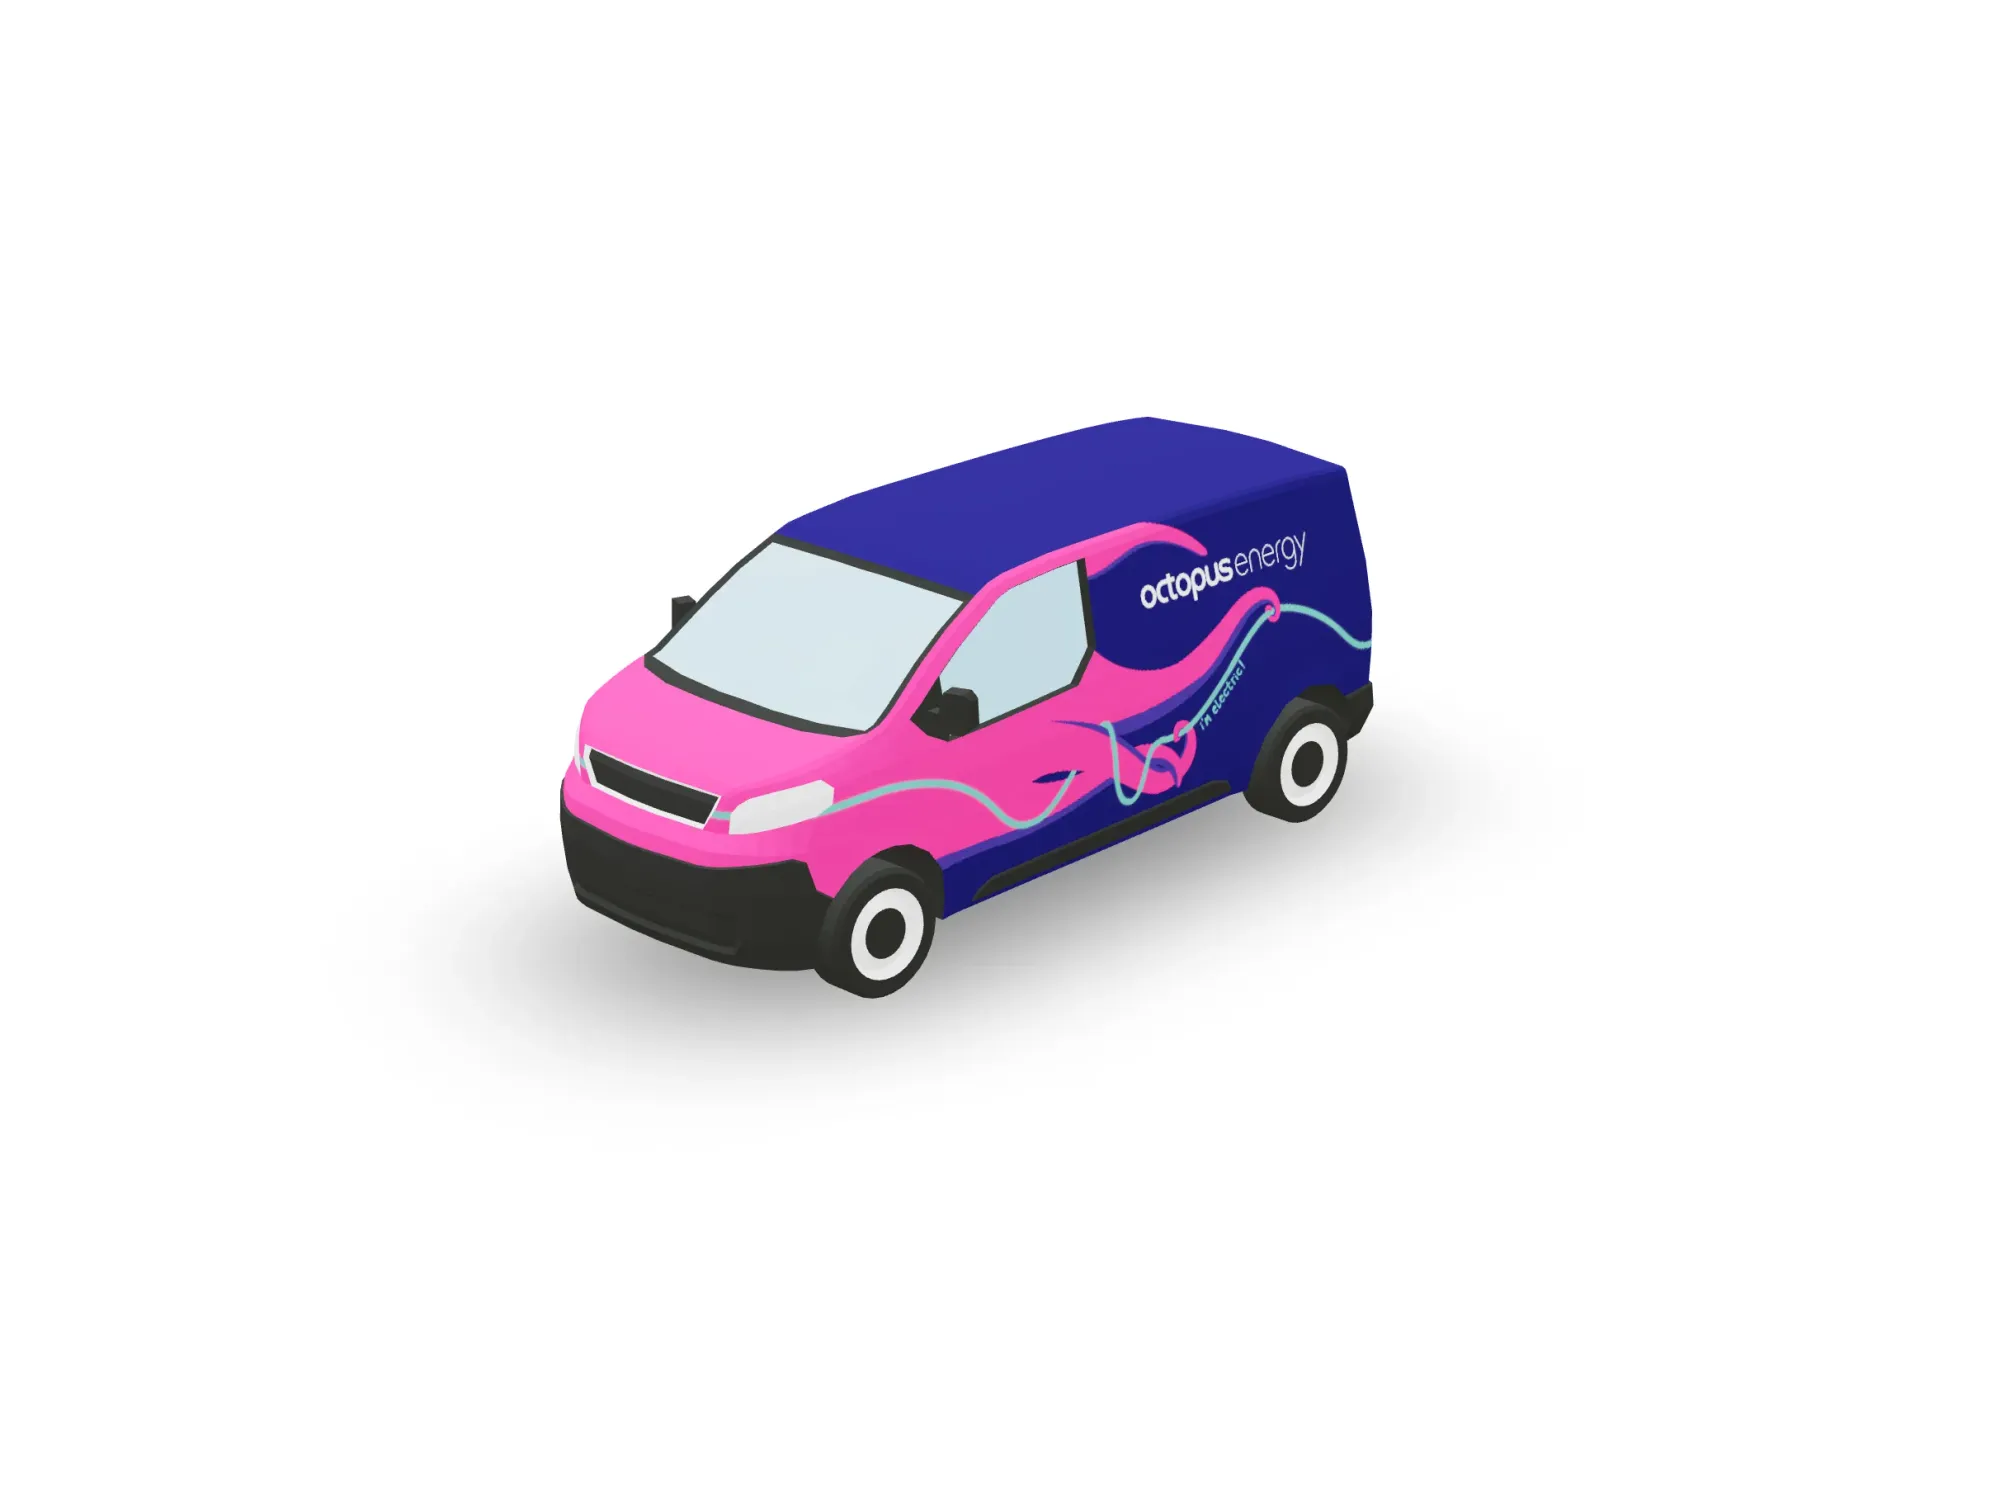
I’m particularly proud of the low-poly Octopus Energy van which certainly tested my abilities within Blender. I learnt so much making it that I’d definitely approach it differently next time, and would likely get it done a lot faster too.
The project is hopefully going live in the near future and I’ll update this post once you can see it and play with it yourself.
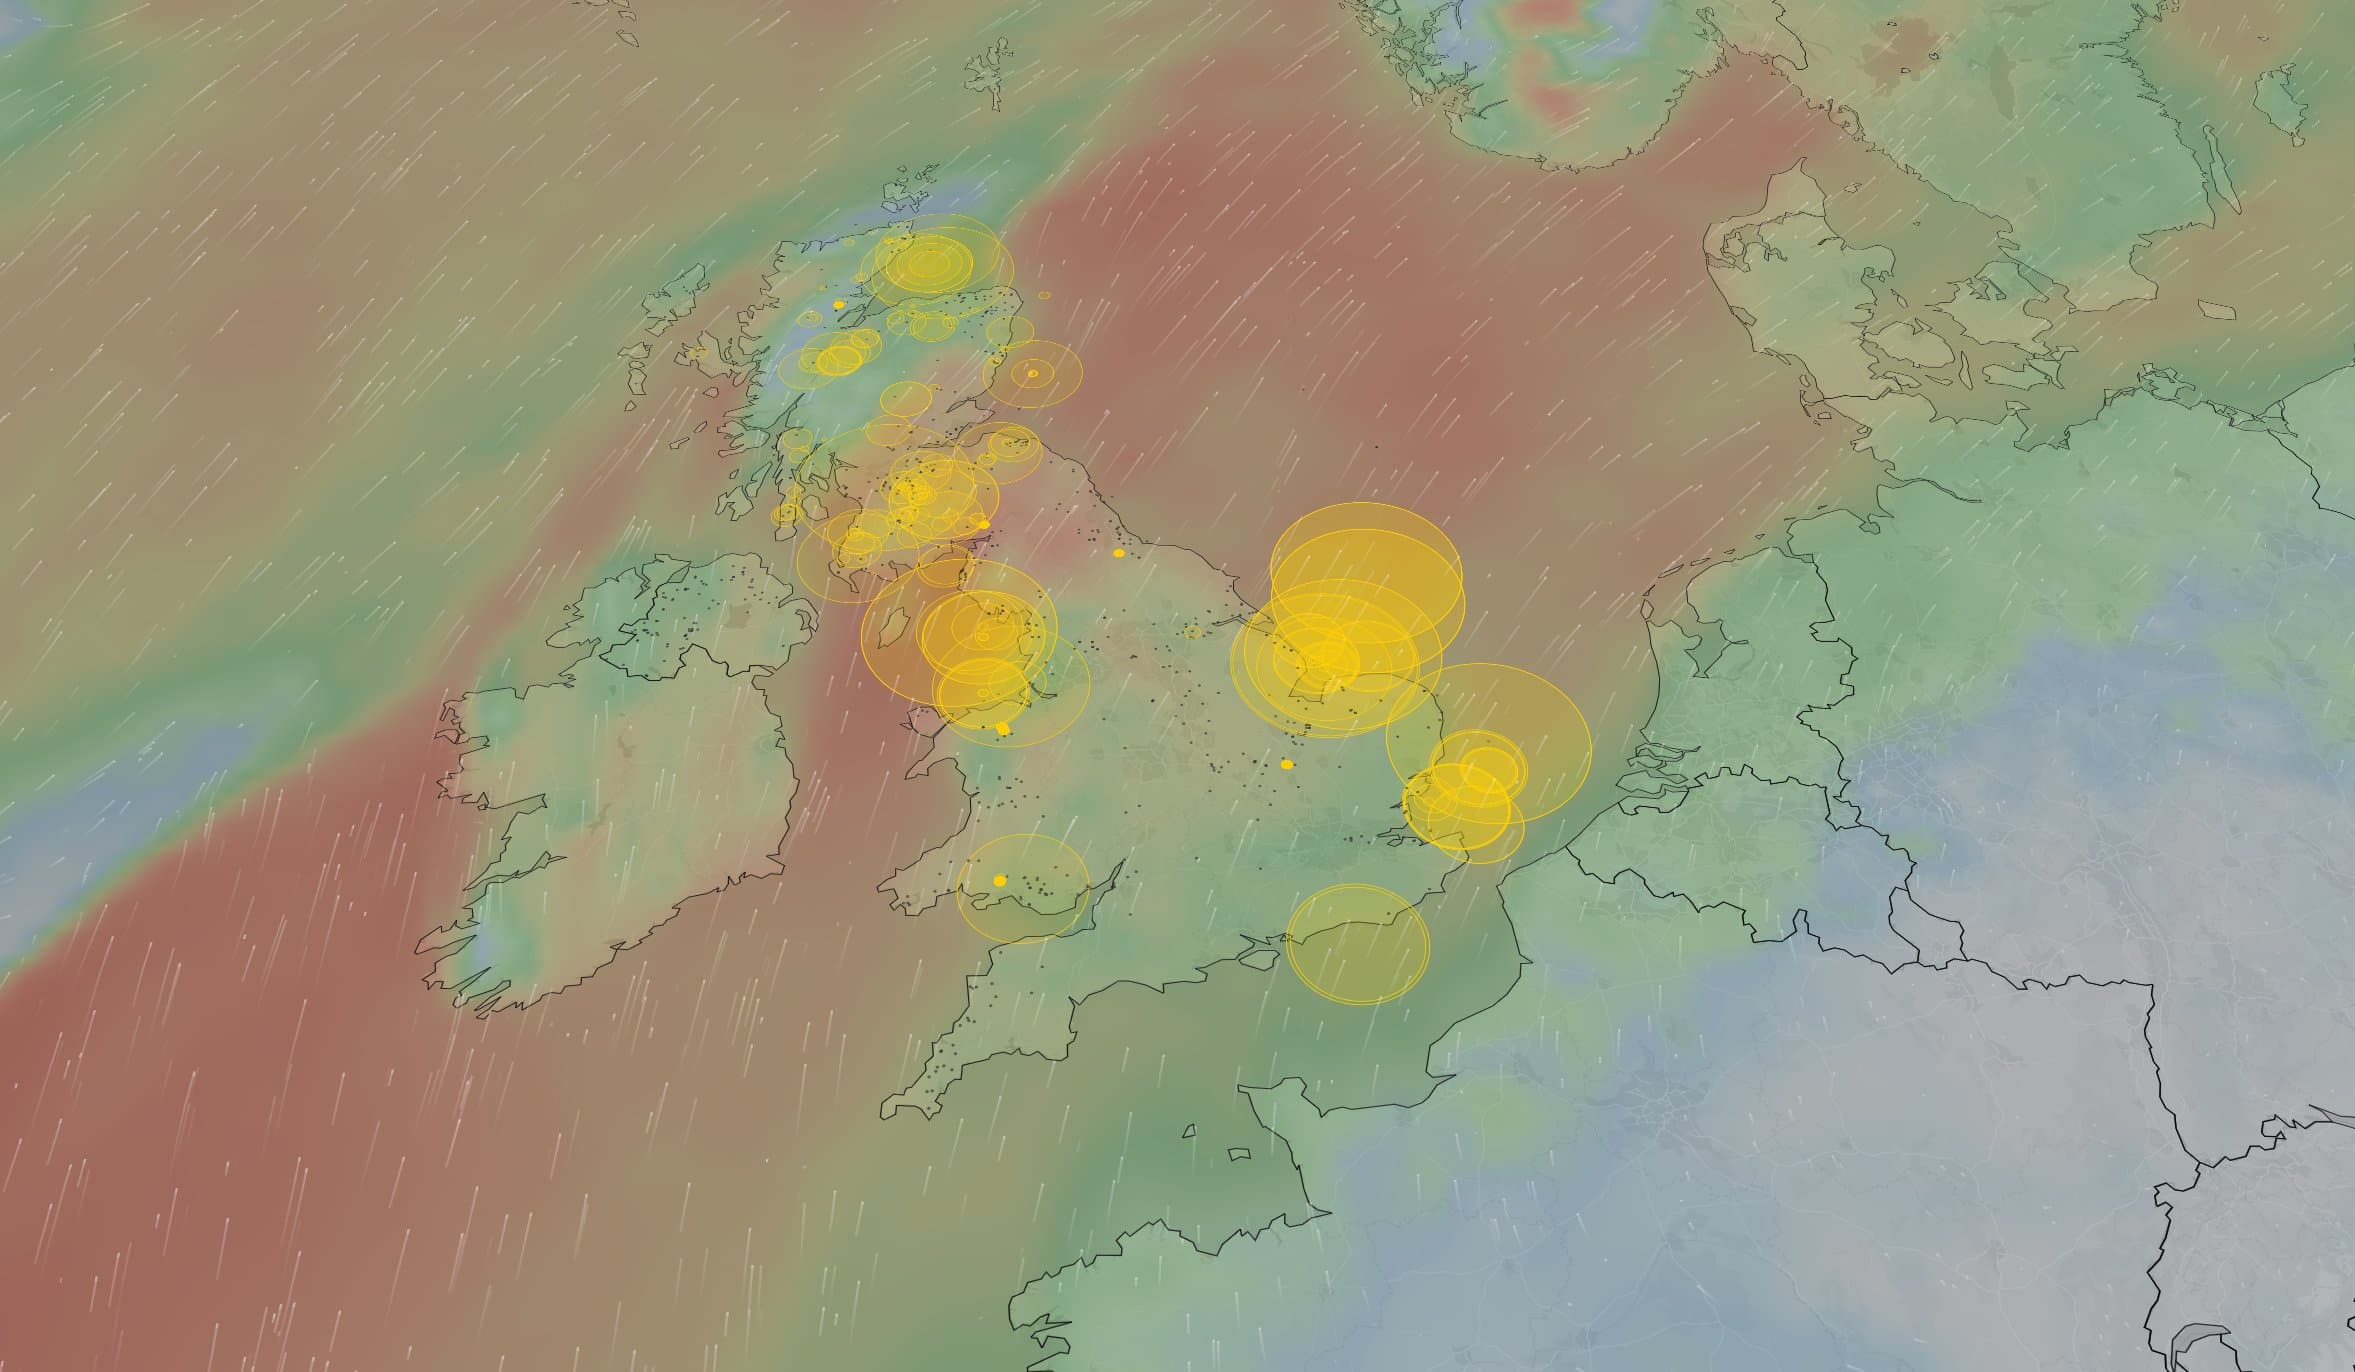
Mapping power outages during Storm Eunice
Back in February the UK experienced an unprecedented storm which caused a huge amount of damage and disruption, particularly with power cuts in the south of the country.
As a result of this I worked with the data team at Octopus to look at how fault monitoring data from smart meters can be used to detect and plot power cuts in a timely manner. Specifically, my role in this was to take the analysis and turn it into an animated map showing a time-lapse of power cuts as the storm progressed.
This was achieved using a variety of tools such as Mapshaper and GDAL for the initial processing, QGIS and its Temporal Controller for the visualisation and time-lapse animation, and finally FFMPEG to stitch the frames for the gif.
It was a fascinating project and one which opened my eyes to the potential of smart meters beyond simply tracking realtime energy usage.
Balance Forecast
Arguably the project I’m most proud of, Balance Forecast is an industry-first tool for Octopus Energy customers to gain a better understanding of energy usage and how the personal cost of energy may change in the near future.
The tool was created in response to the disruption with the global energy markets and its impact on the cost of energy for consumers. Specifically, the tool aims to help demystify direct debit payments for energy usage and why a particular fixed payment amount is recommended. It also allows customers to experiment with different payment amounts to see how that impacts their future balance.
As a brief overview, fixed direct debit payments allow for consistent and predictable payments and are often preferred. However, it can sometimes be confusing why you might pay more than you use some months, and less than you use in others. This is typically because your energy usage fluctuates throughout the year and so you may be paying slightly more than you use in summer to cover higher usage in winter, and paying slightly less than you use in winter as a result.
While the visualisation of usage and direct debit payments was important, what really stood out on this project was the introduction of the “Crystal Ball” mode. This was an attempt to show how changes in the consumer energy price cap may impact the future personal cost of energy. It was a bold industry-first initiative which really cemented to me why Octopus has been so innovative and disruptive.
In terms of technology, the visualisation elements of tool mostly consist of a custom D3 chart alongside a bunch of logic to calculate the necessary output based on forecast energy usage data.
The project also demonstrated to me how quickly Octopus can move from idea to prototype to initial public release. In this case we launched a functional prototype to millions of customers within just a few weeks of the first idea.
Octopus Energy 404 page
By far the silliest project I worked on this year was the new Octopus Energy 404 page, featuring an interactive 3D ball pond full of Constantines (the mascot).
Saving Sessions infographics
Rounding off the year at work was a series of infographics that I produced to showcase the results of the first five Octopus Saving Sessions events.
These sessions are part of the innovative Demand Flexibility Service, providing a new mechanism for better-managing the electricity grid during peak times. In summary the new service encourages households to offset their energy usage at busy times and receive an incentive for doing so, like money off bills.
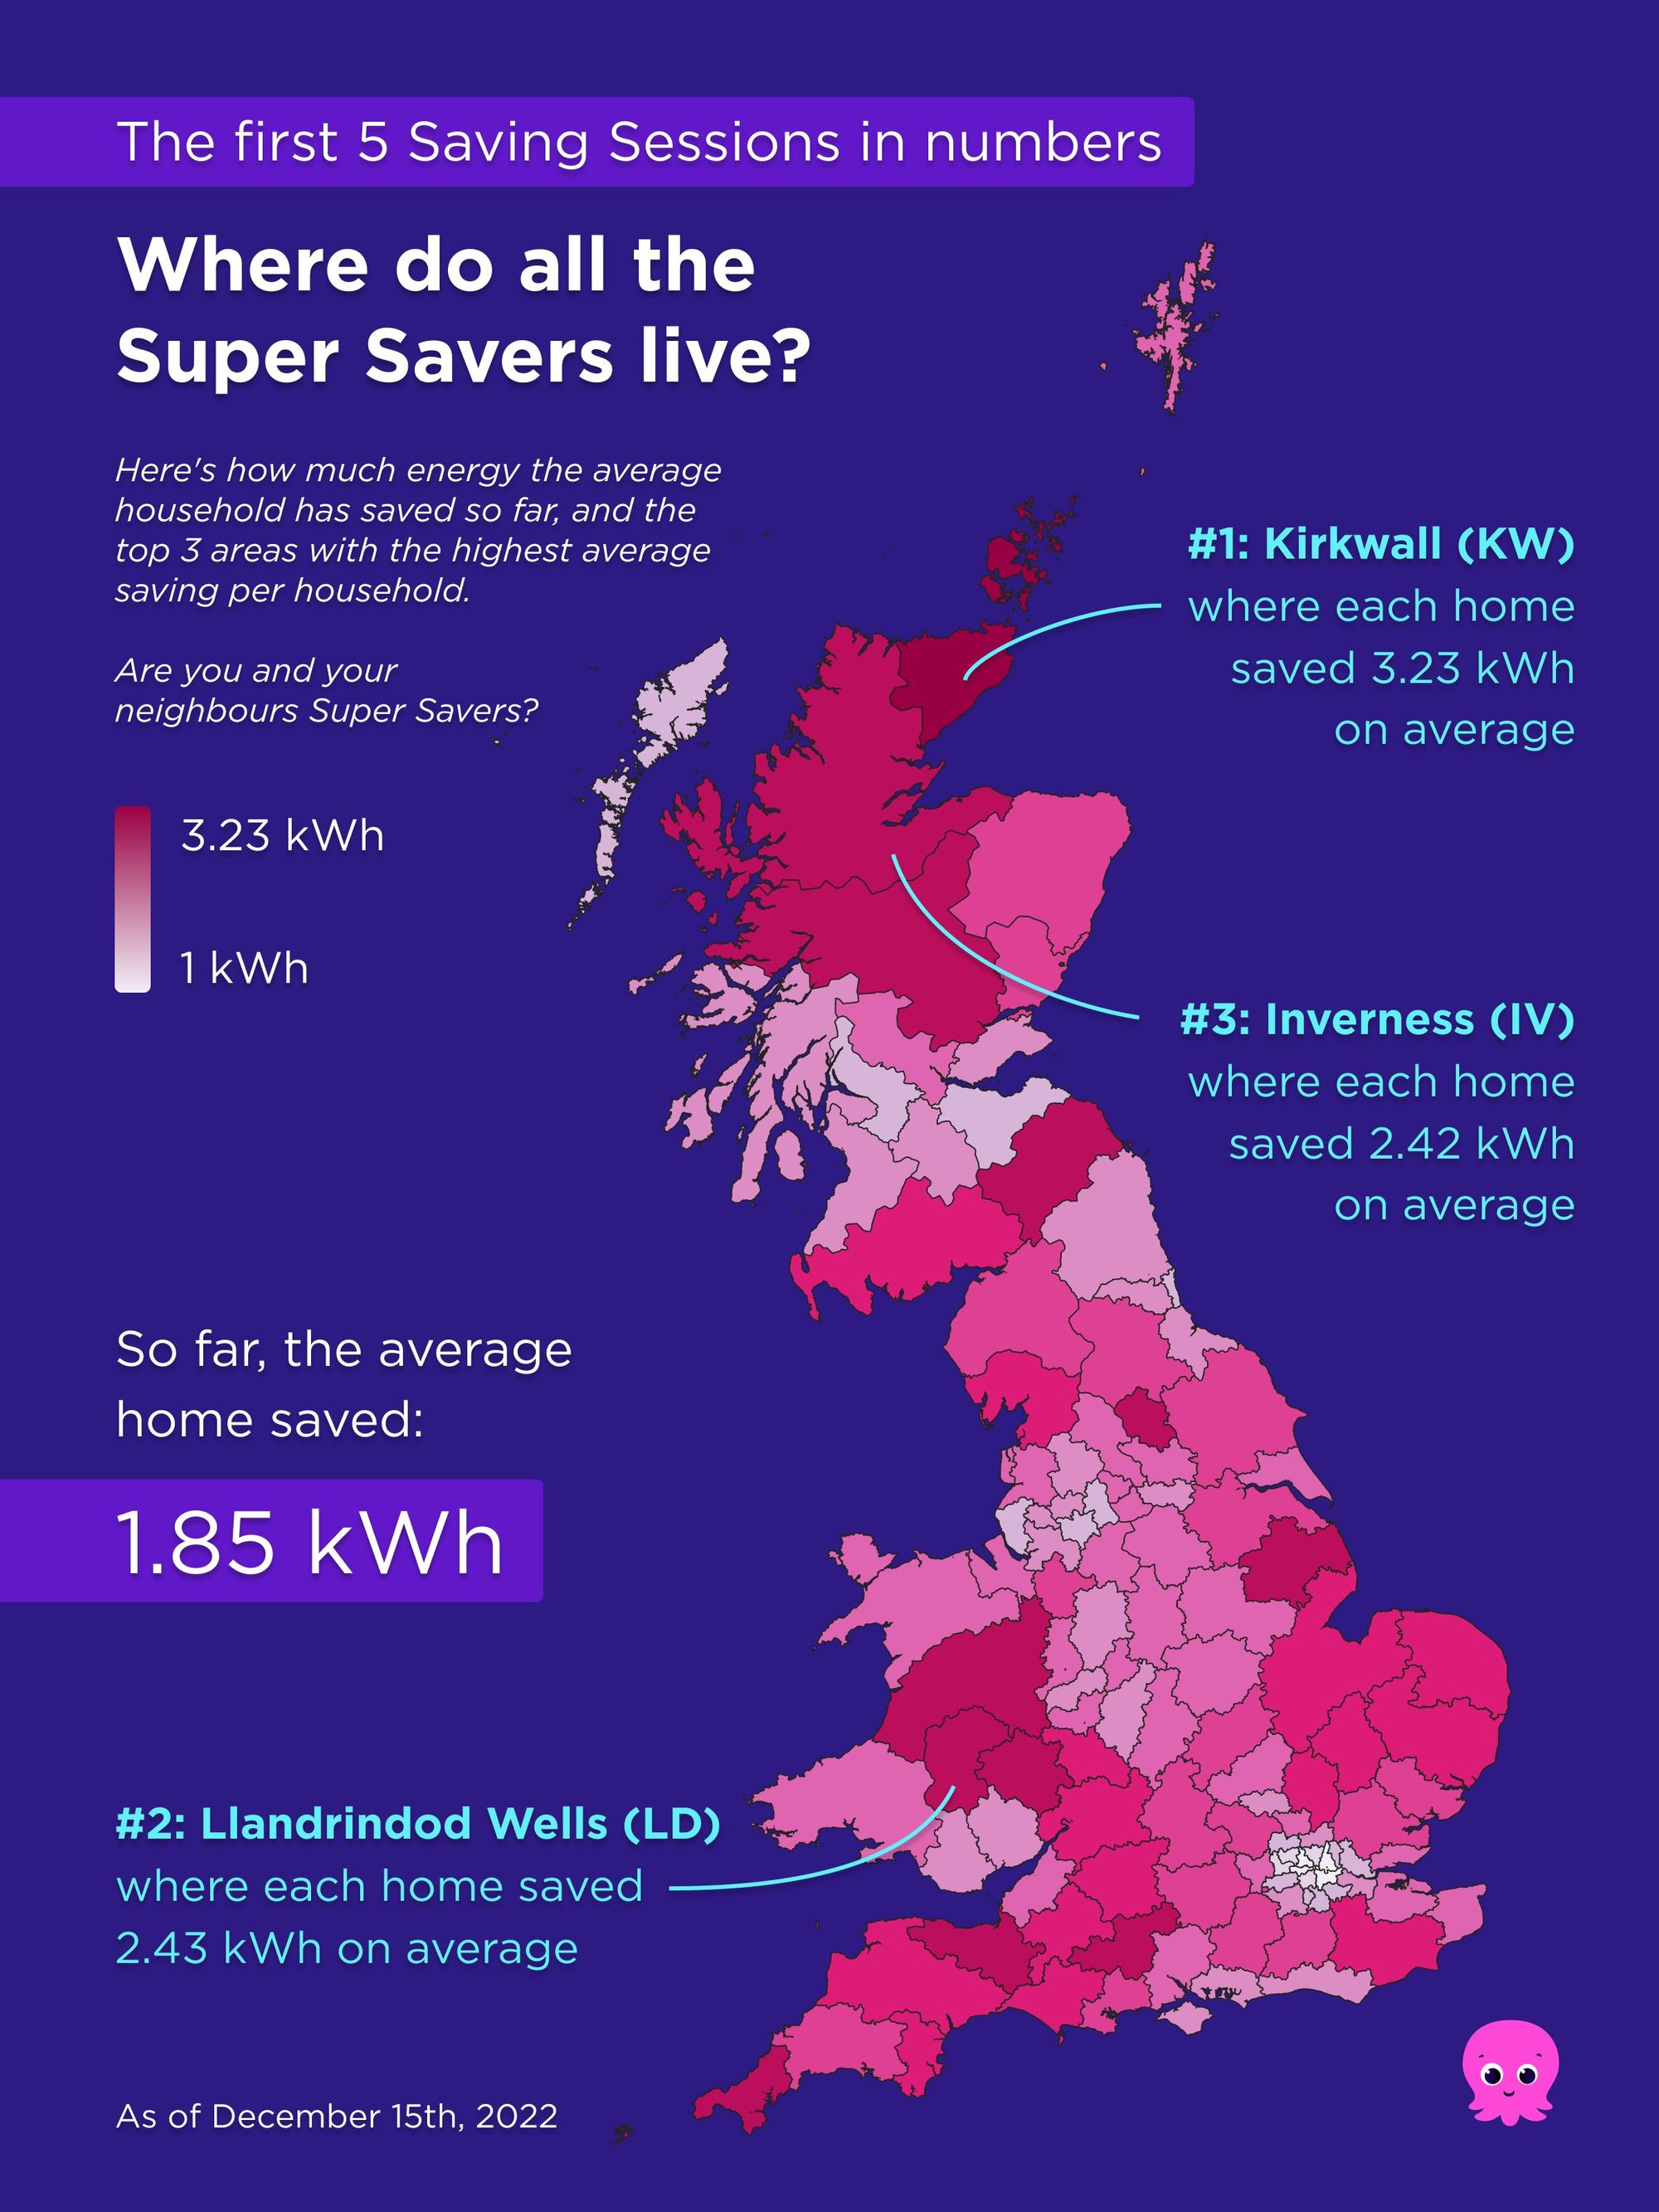
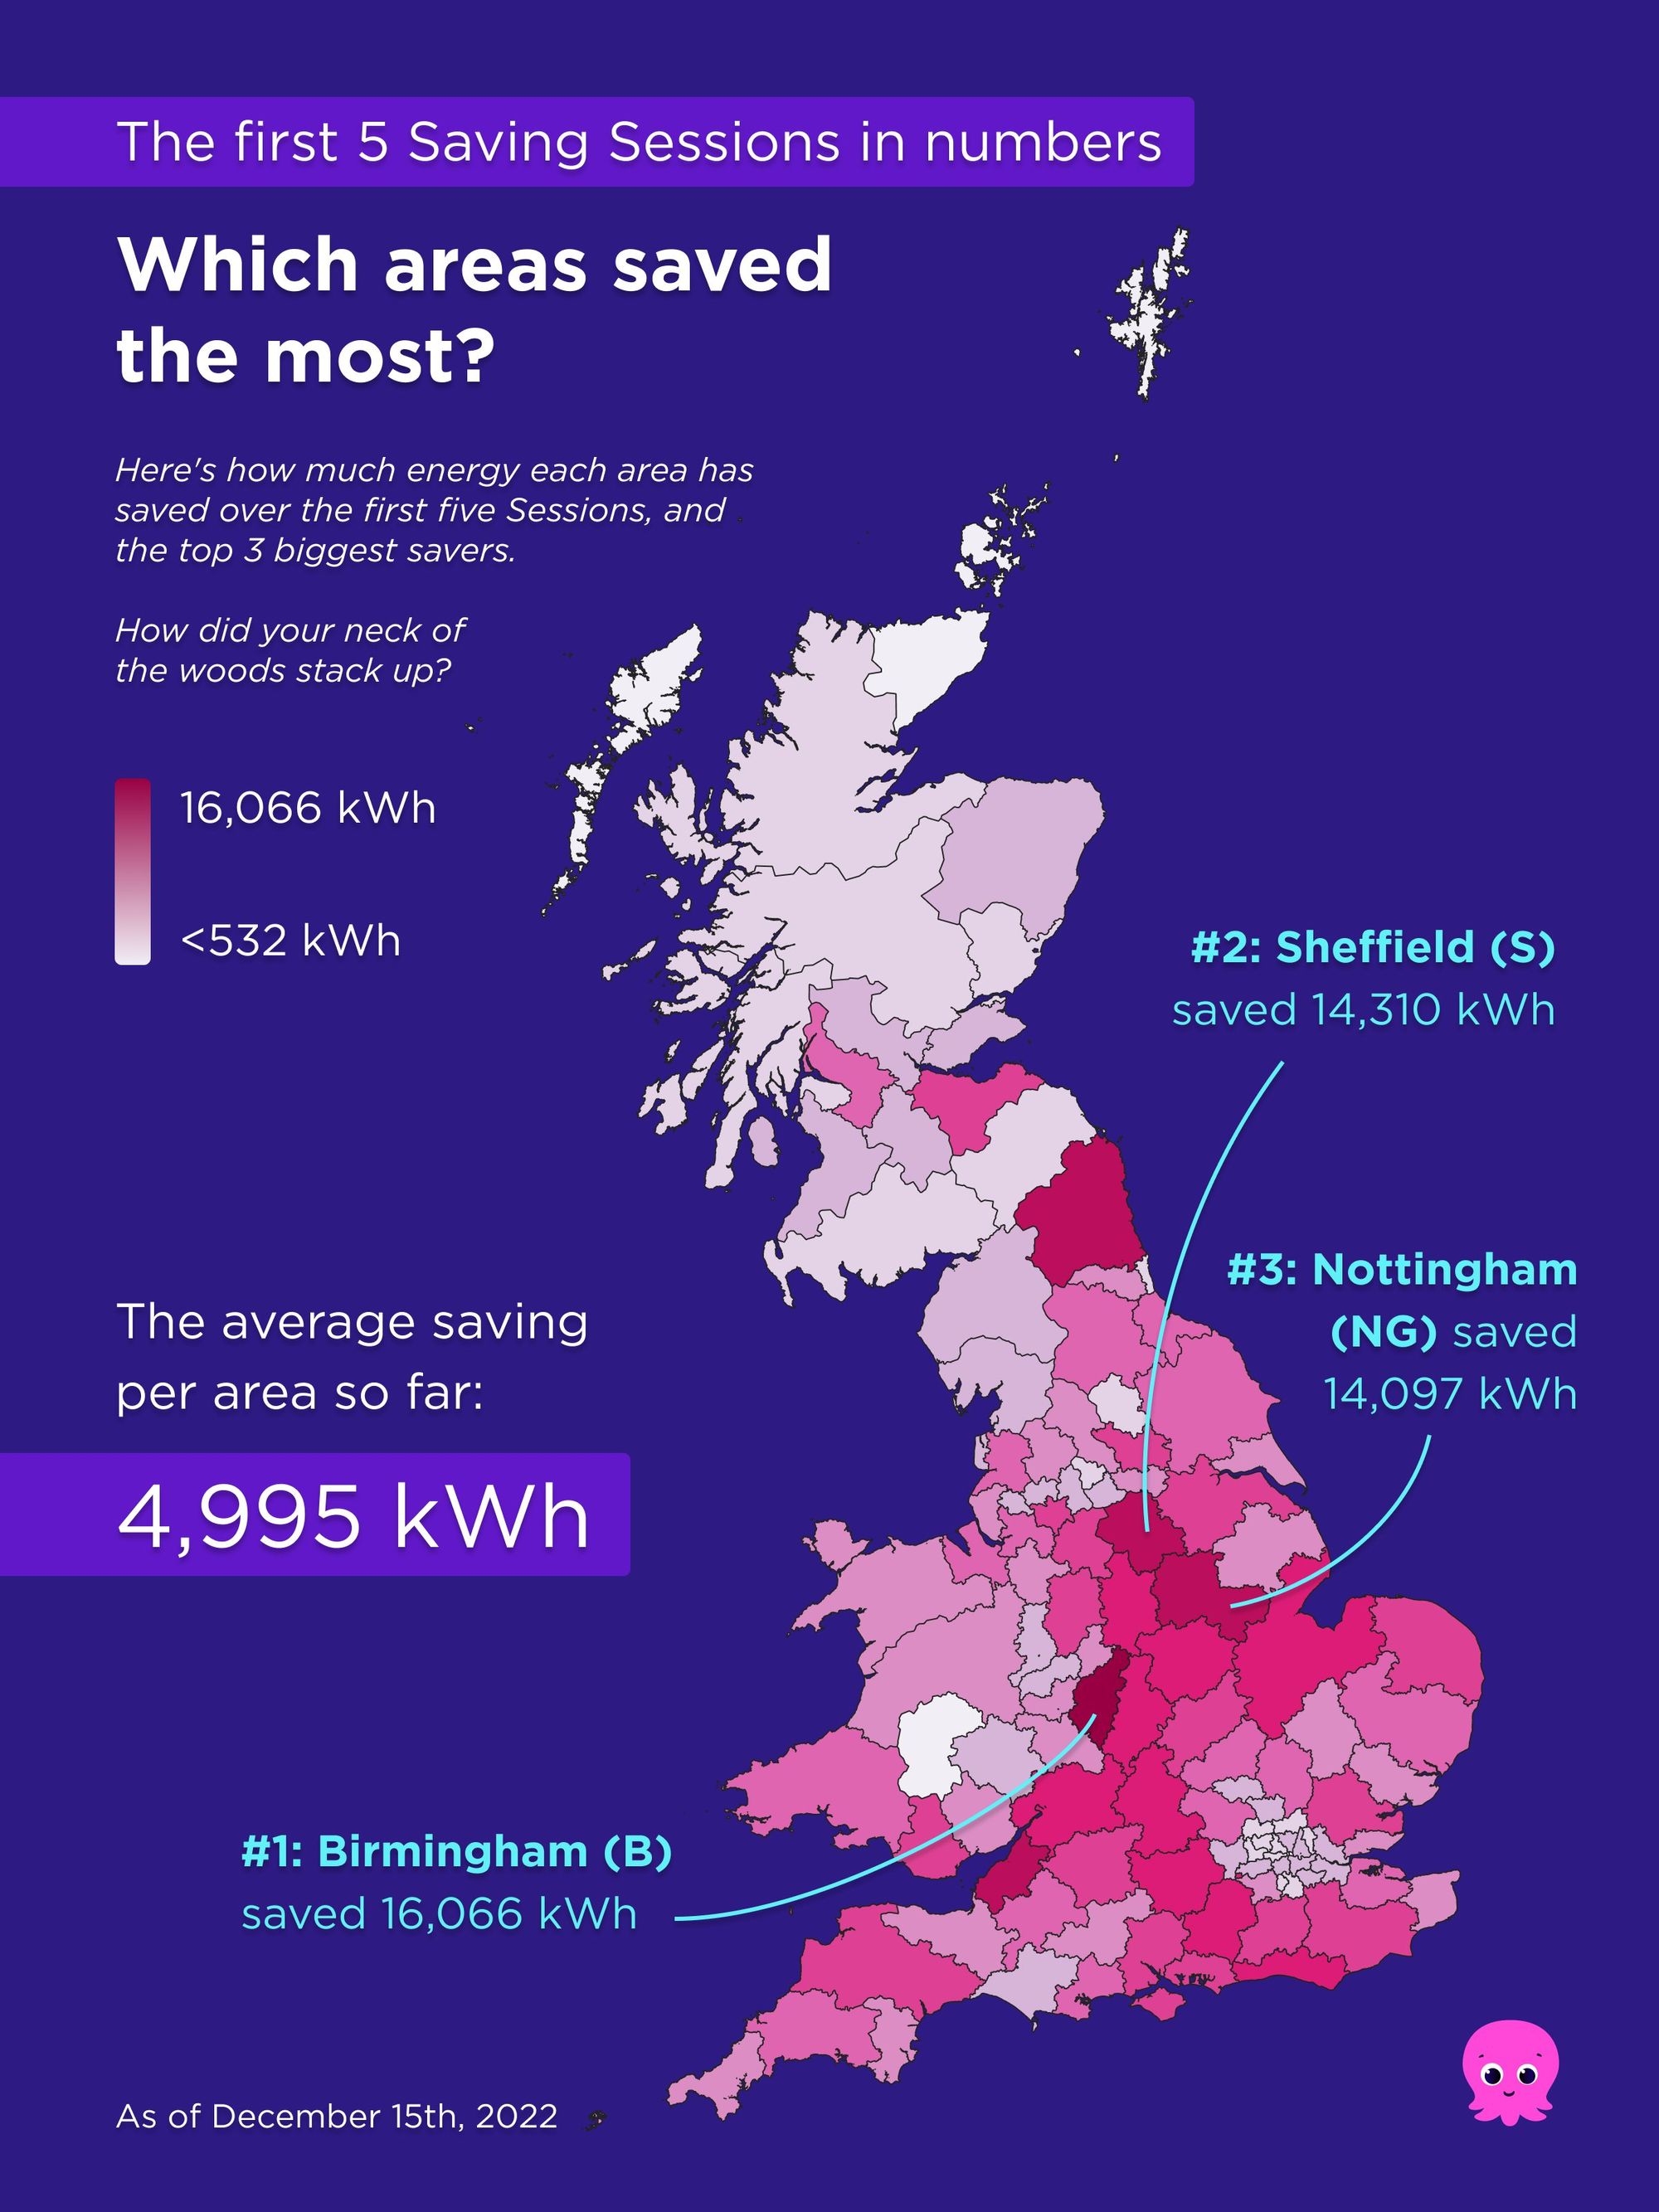
The infographics were produced using a combination of QGIS for the spatial processing and then importing the SVG map into Figma for the layout and final design. It was my first time using Figma in this way and I’m completely sold on using it a tool for spatial visualisation.
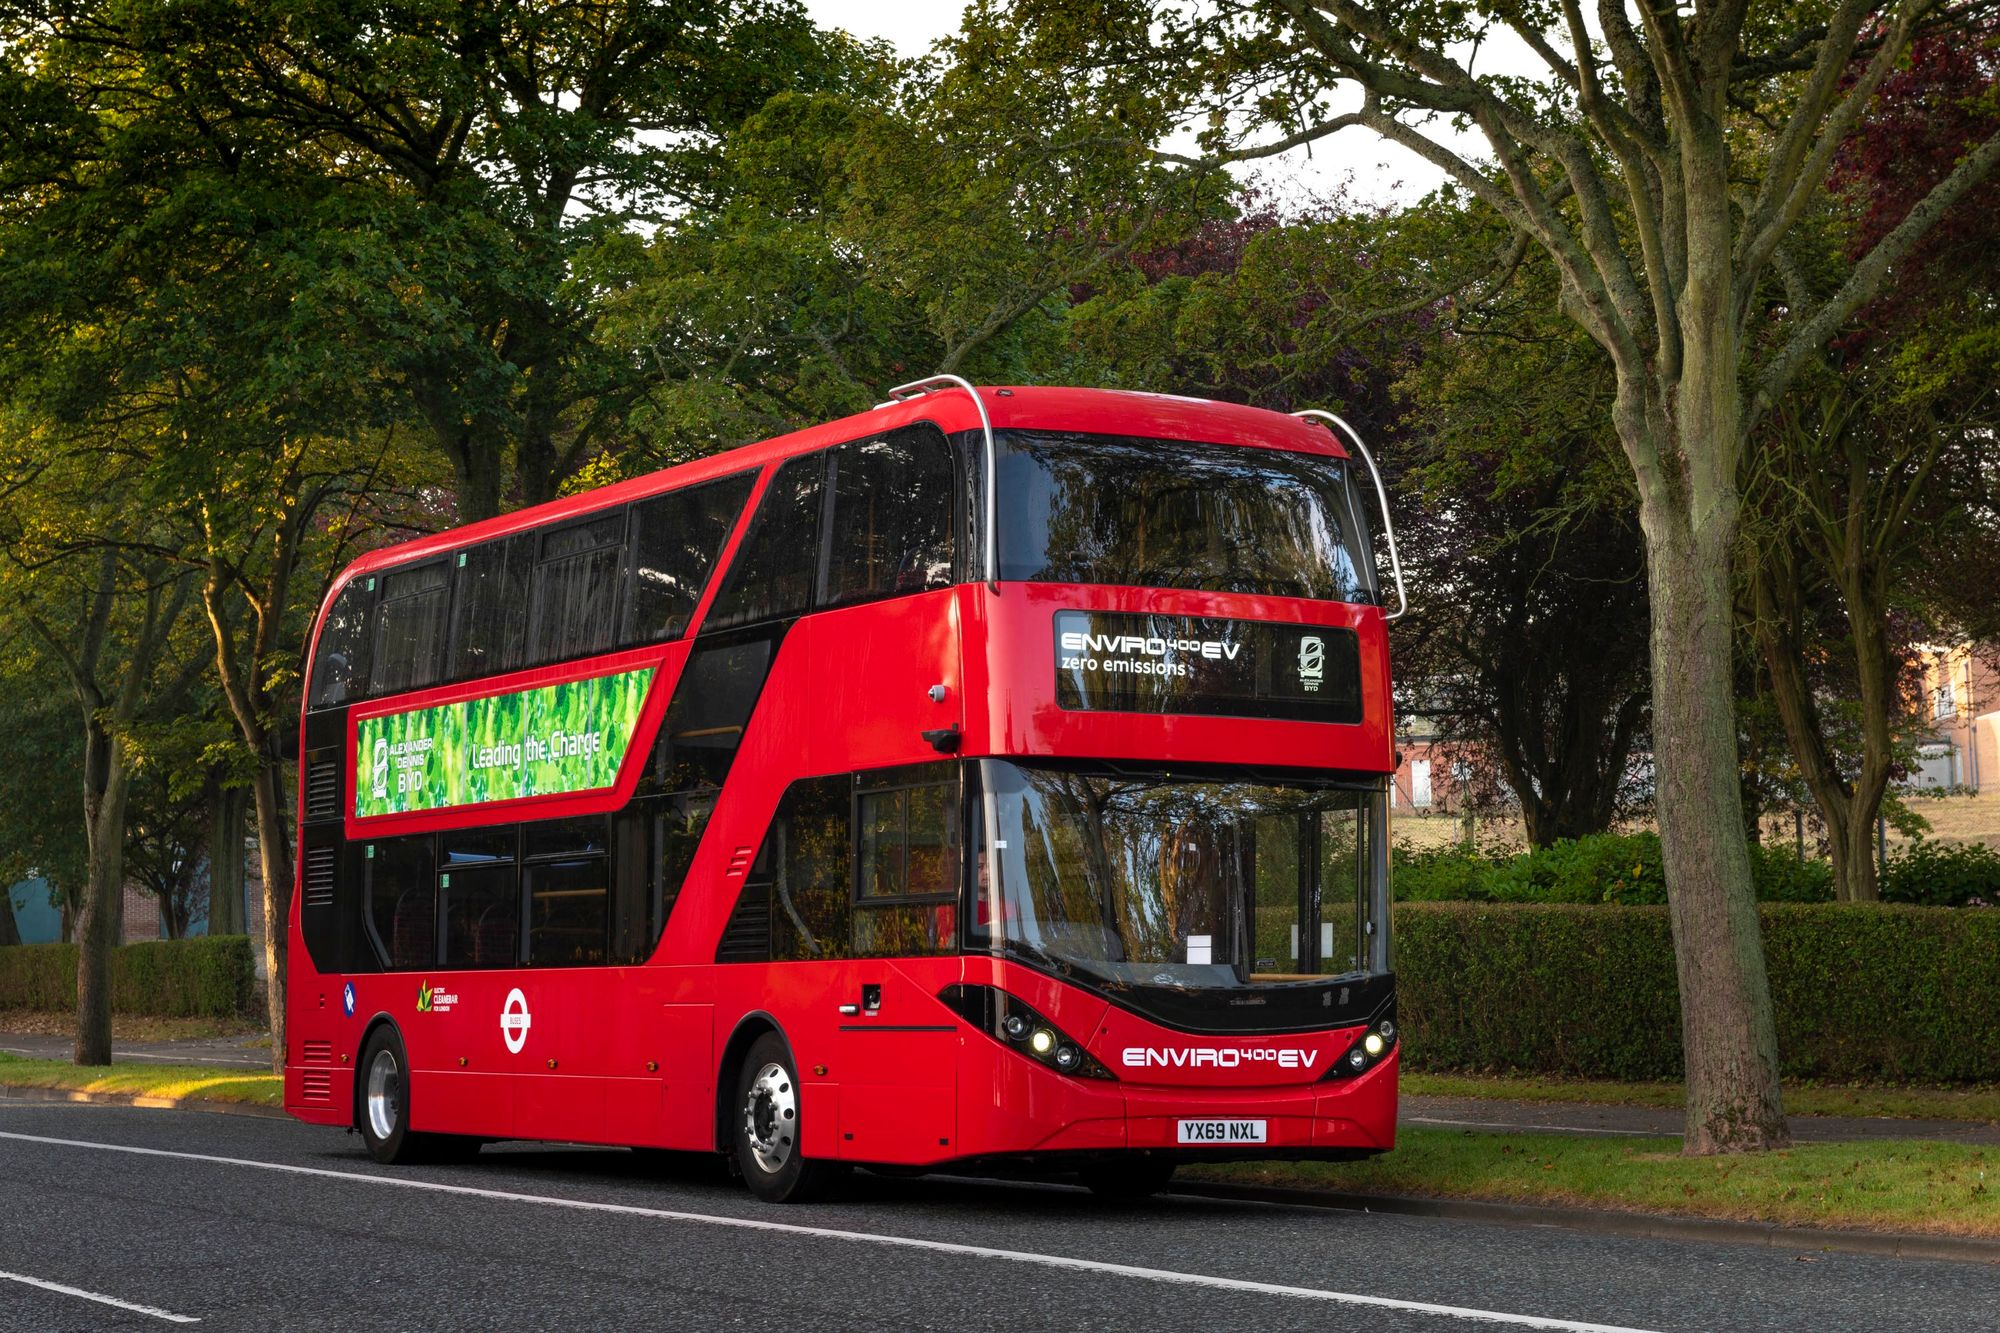
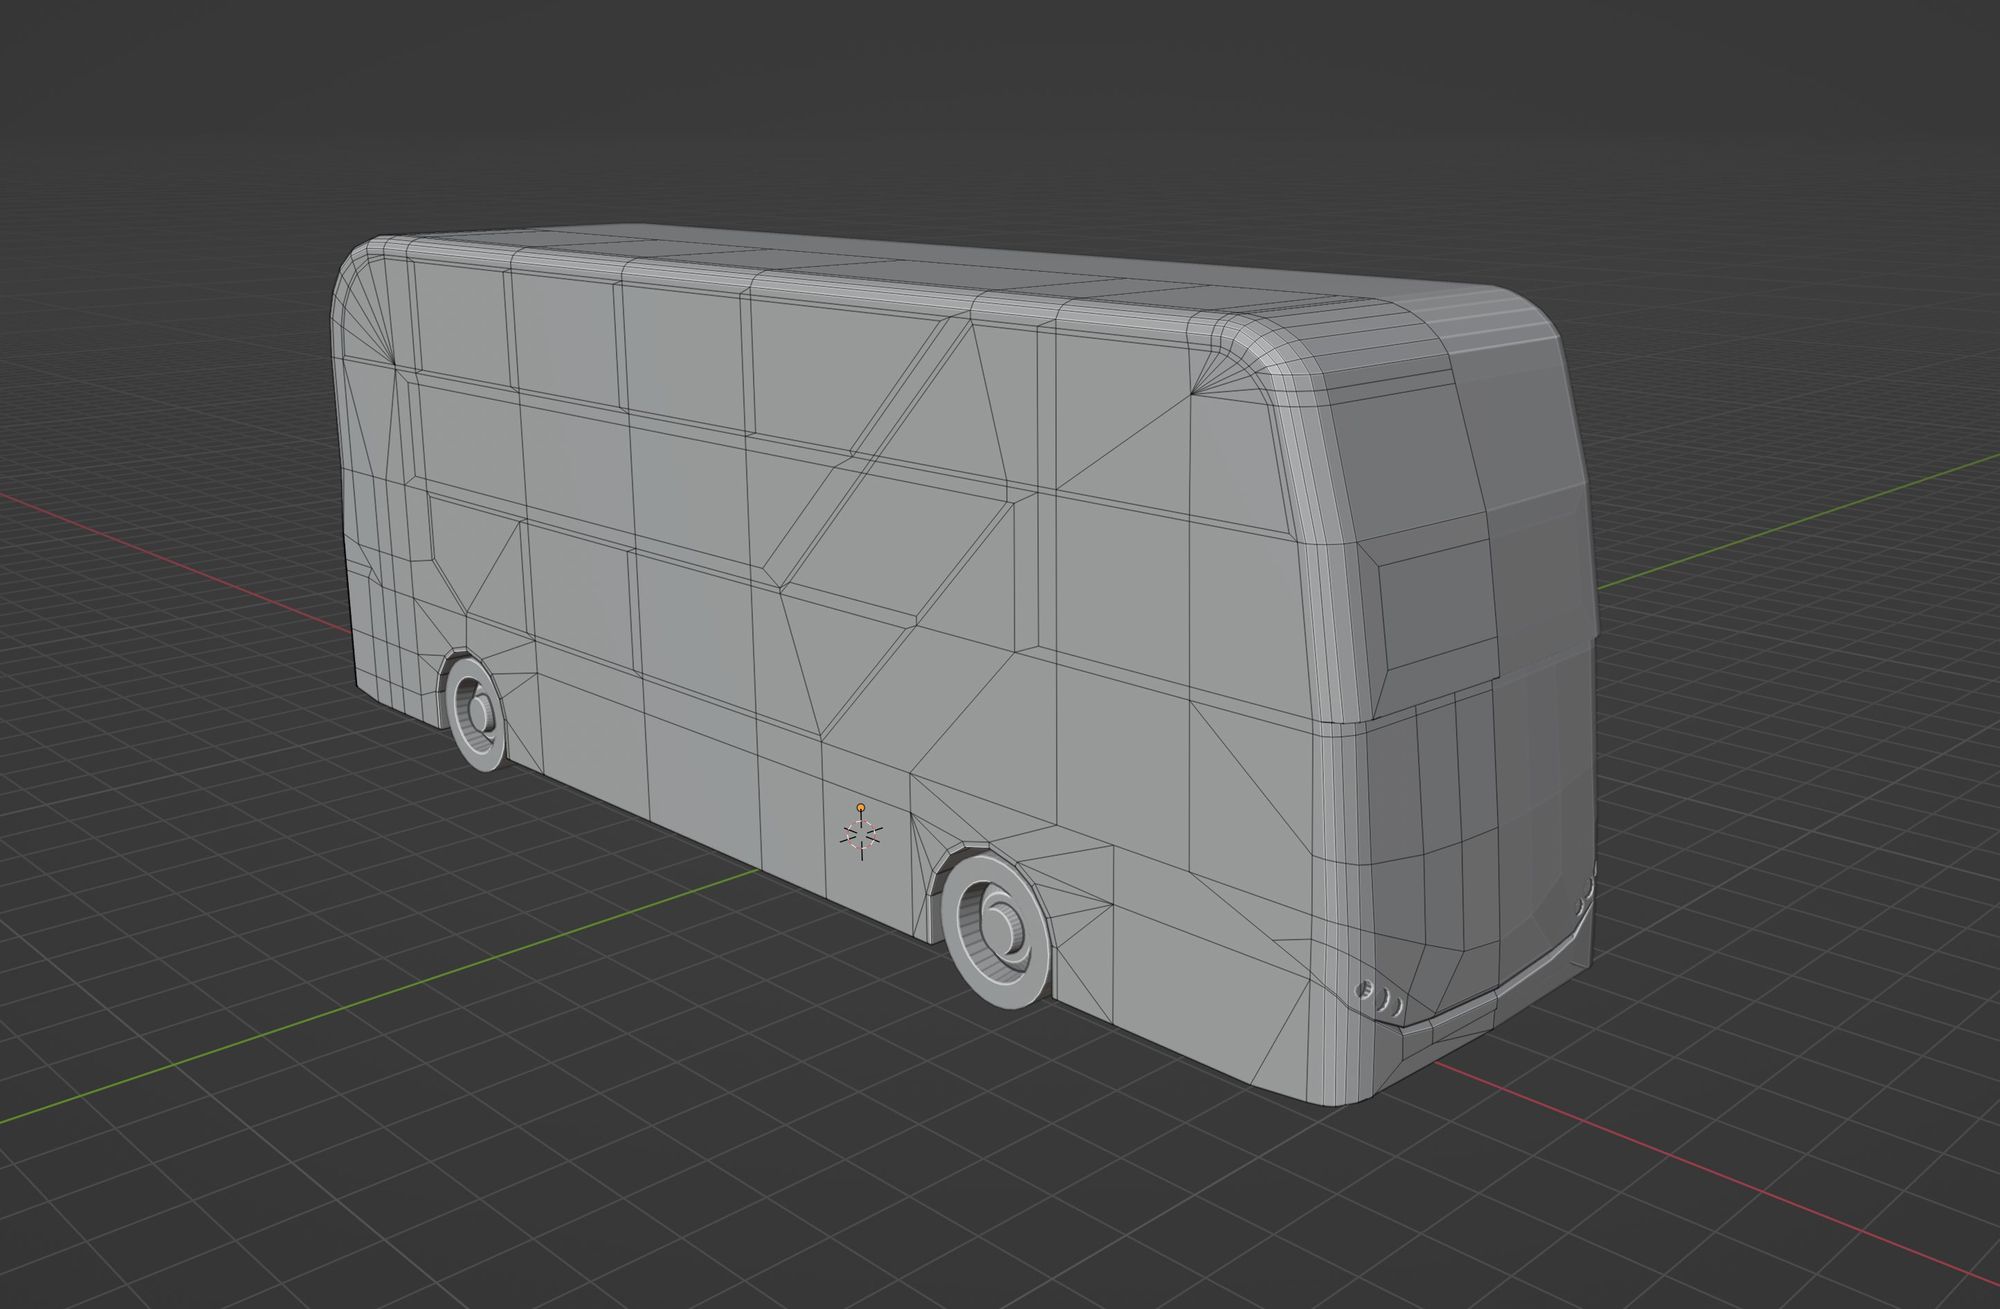
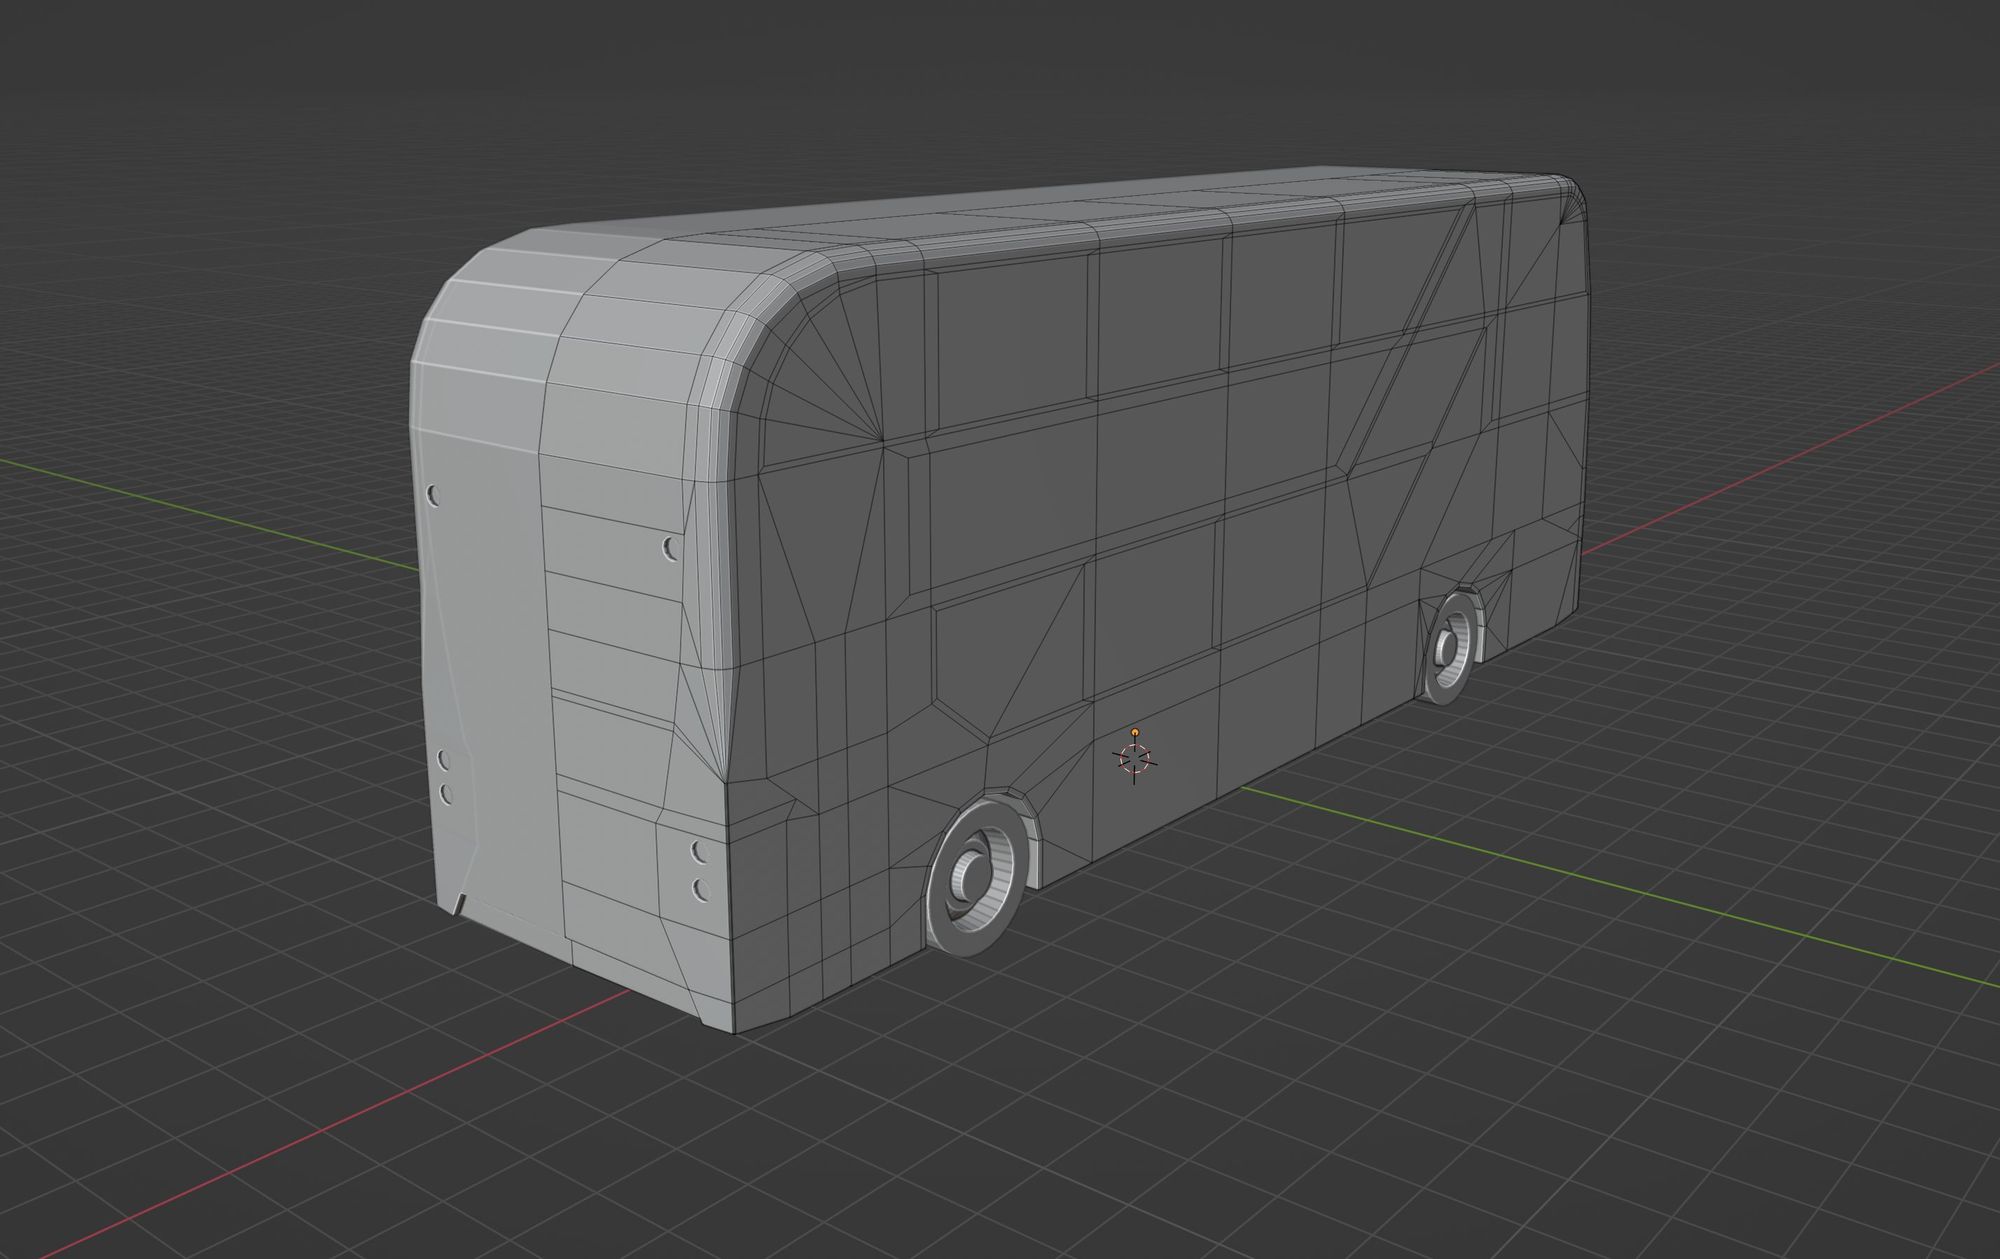
Drivable electric London bus
Another fun project this year was a miniature drivable bus experience that you can play with in your browser. The model was created in Blender and the experience was created using react-three-fiber, expanding on an existing demo.
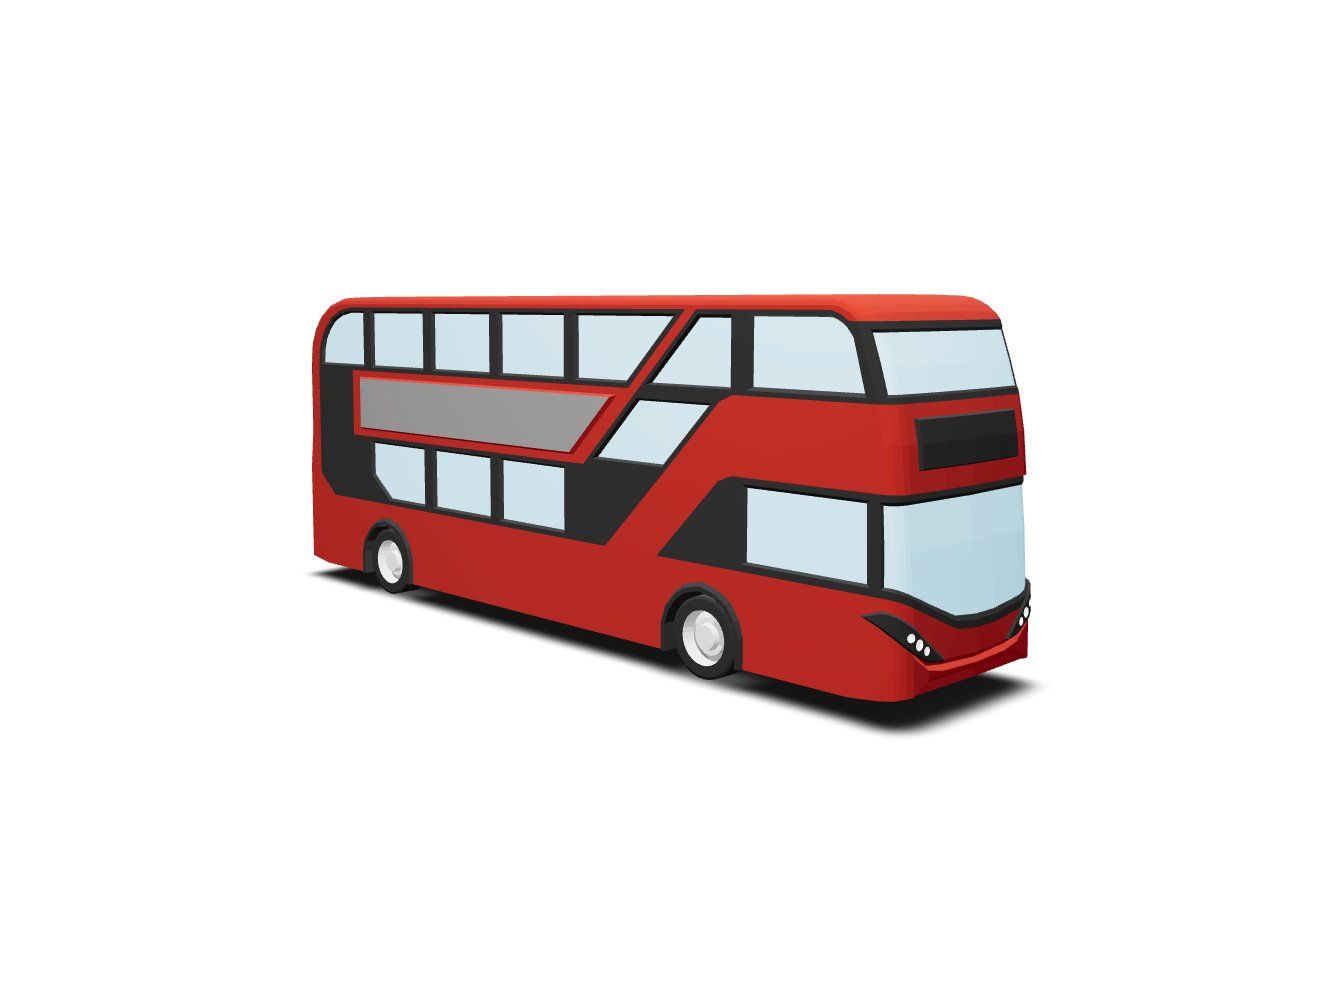
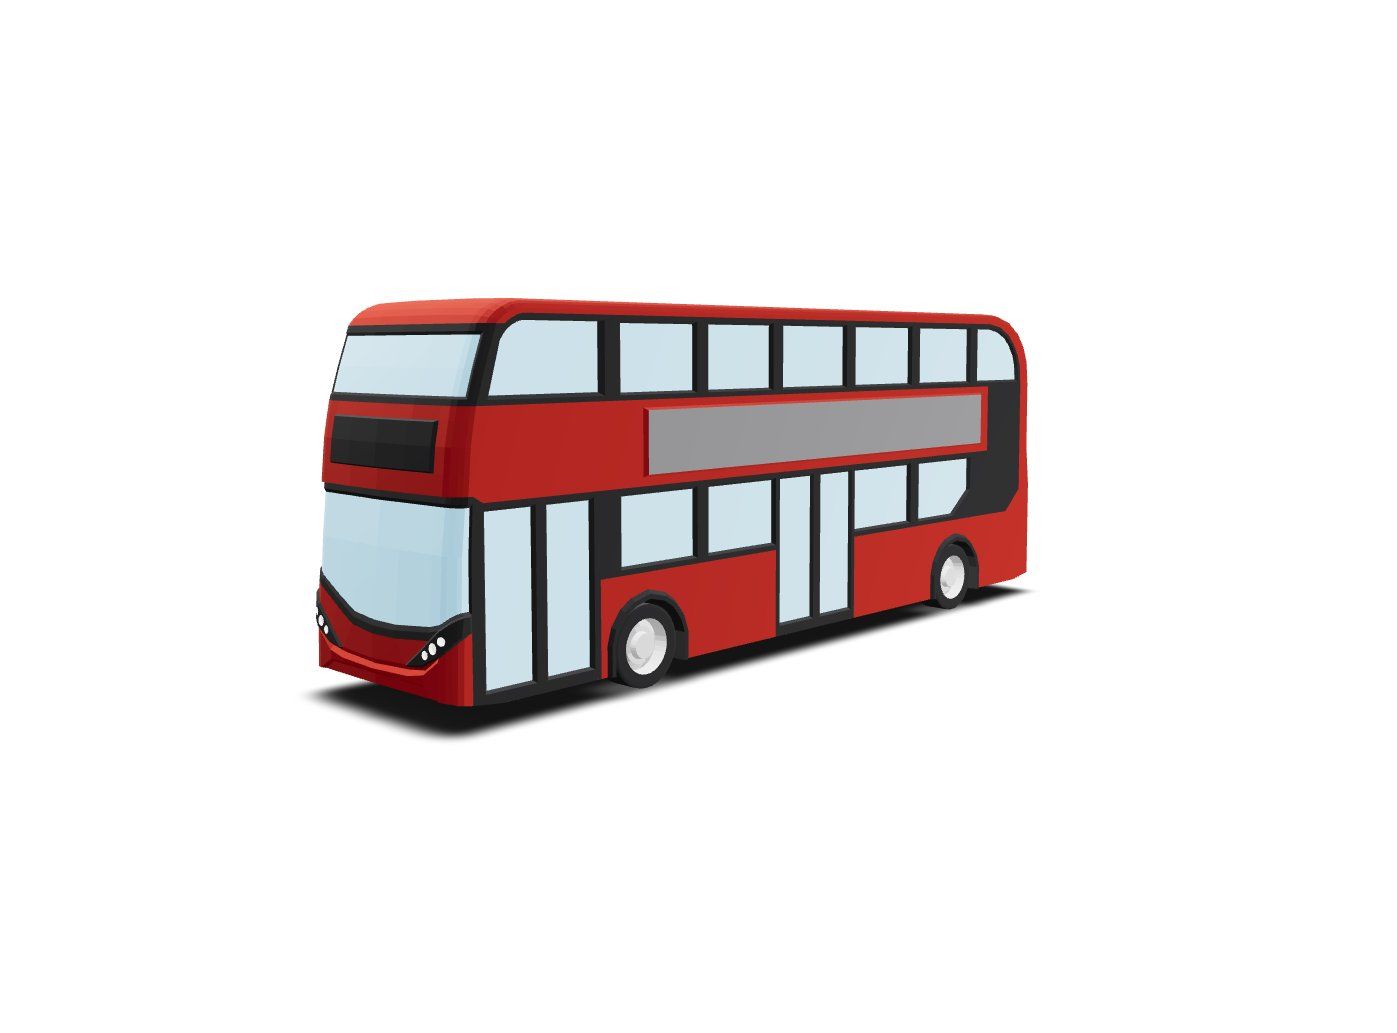
I learnt a tonne about 3D modelling in Blender as a result, particularly all the little shortcuts and tricks to make things easier, like bevels and rounded corners. Some of which I only discovered half-way through modelling and would have saved hours of manually fiddling with individual vertices.
Live map of electric London buses
Continuing my obsession with electric vehicles and public transport, I spent a lot of time this year collecting data around electric buses in London and plotting them on a live map for anyone to see.
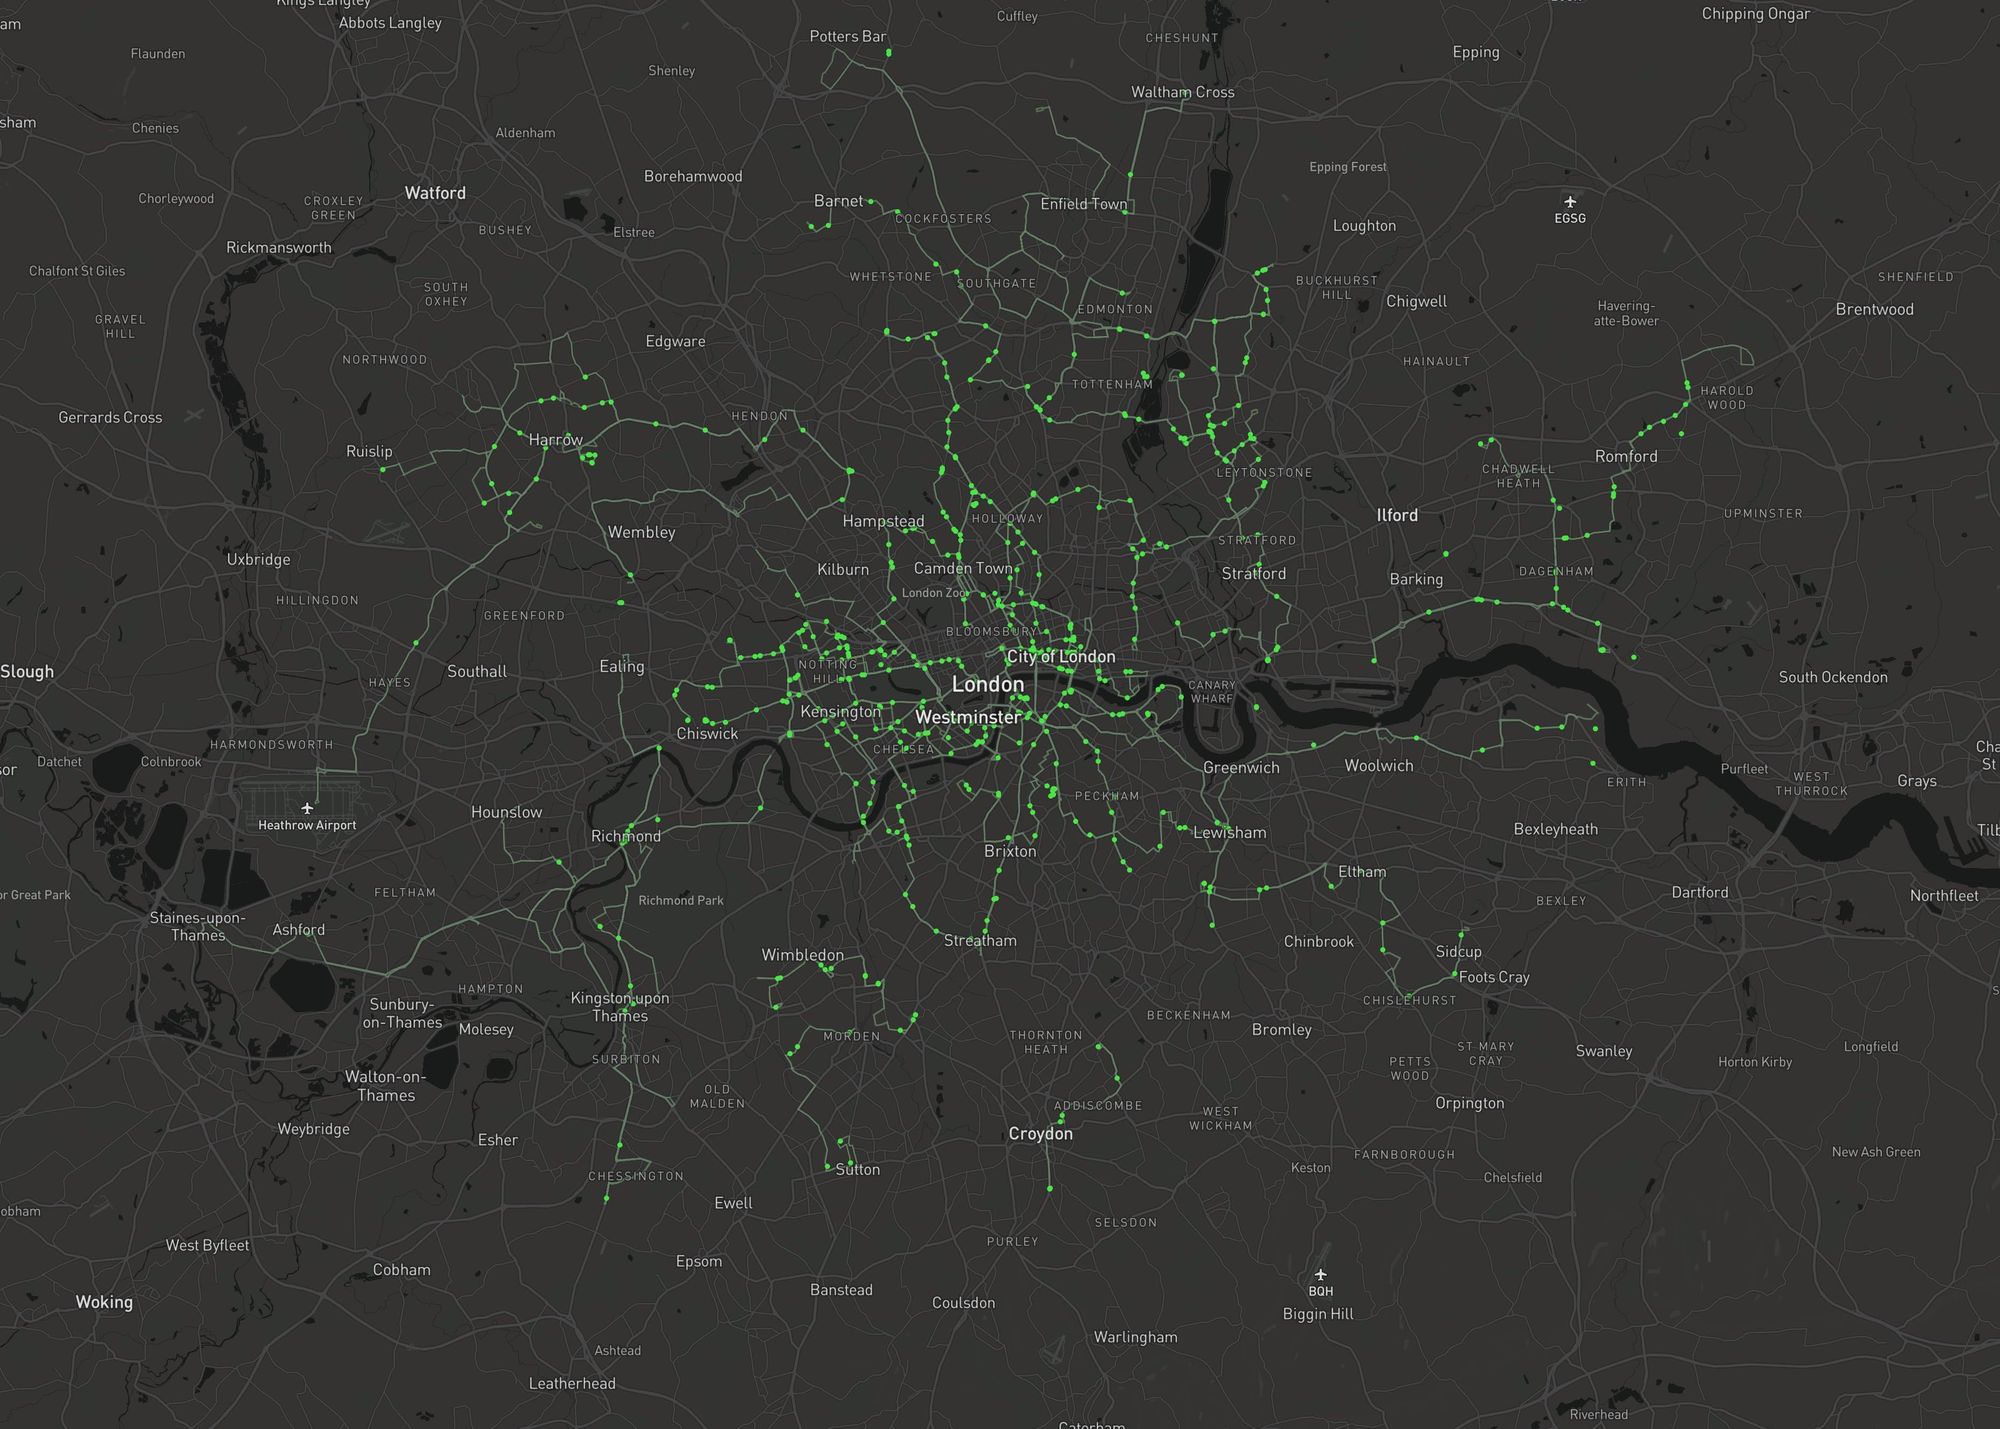
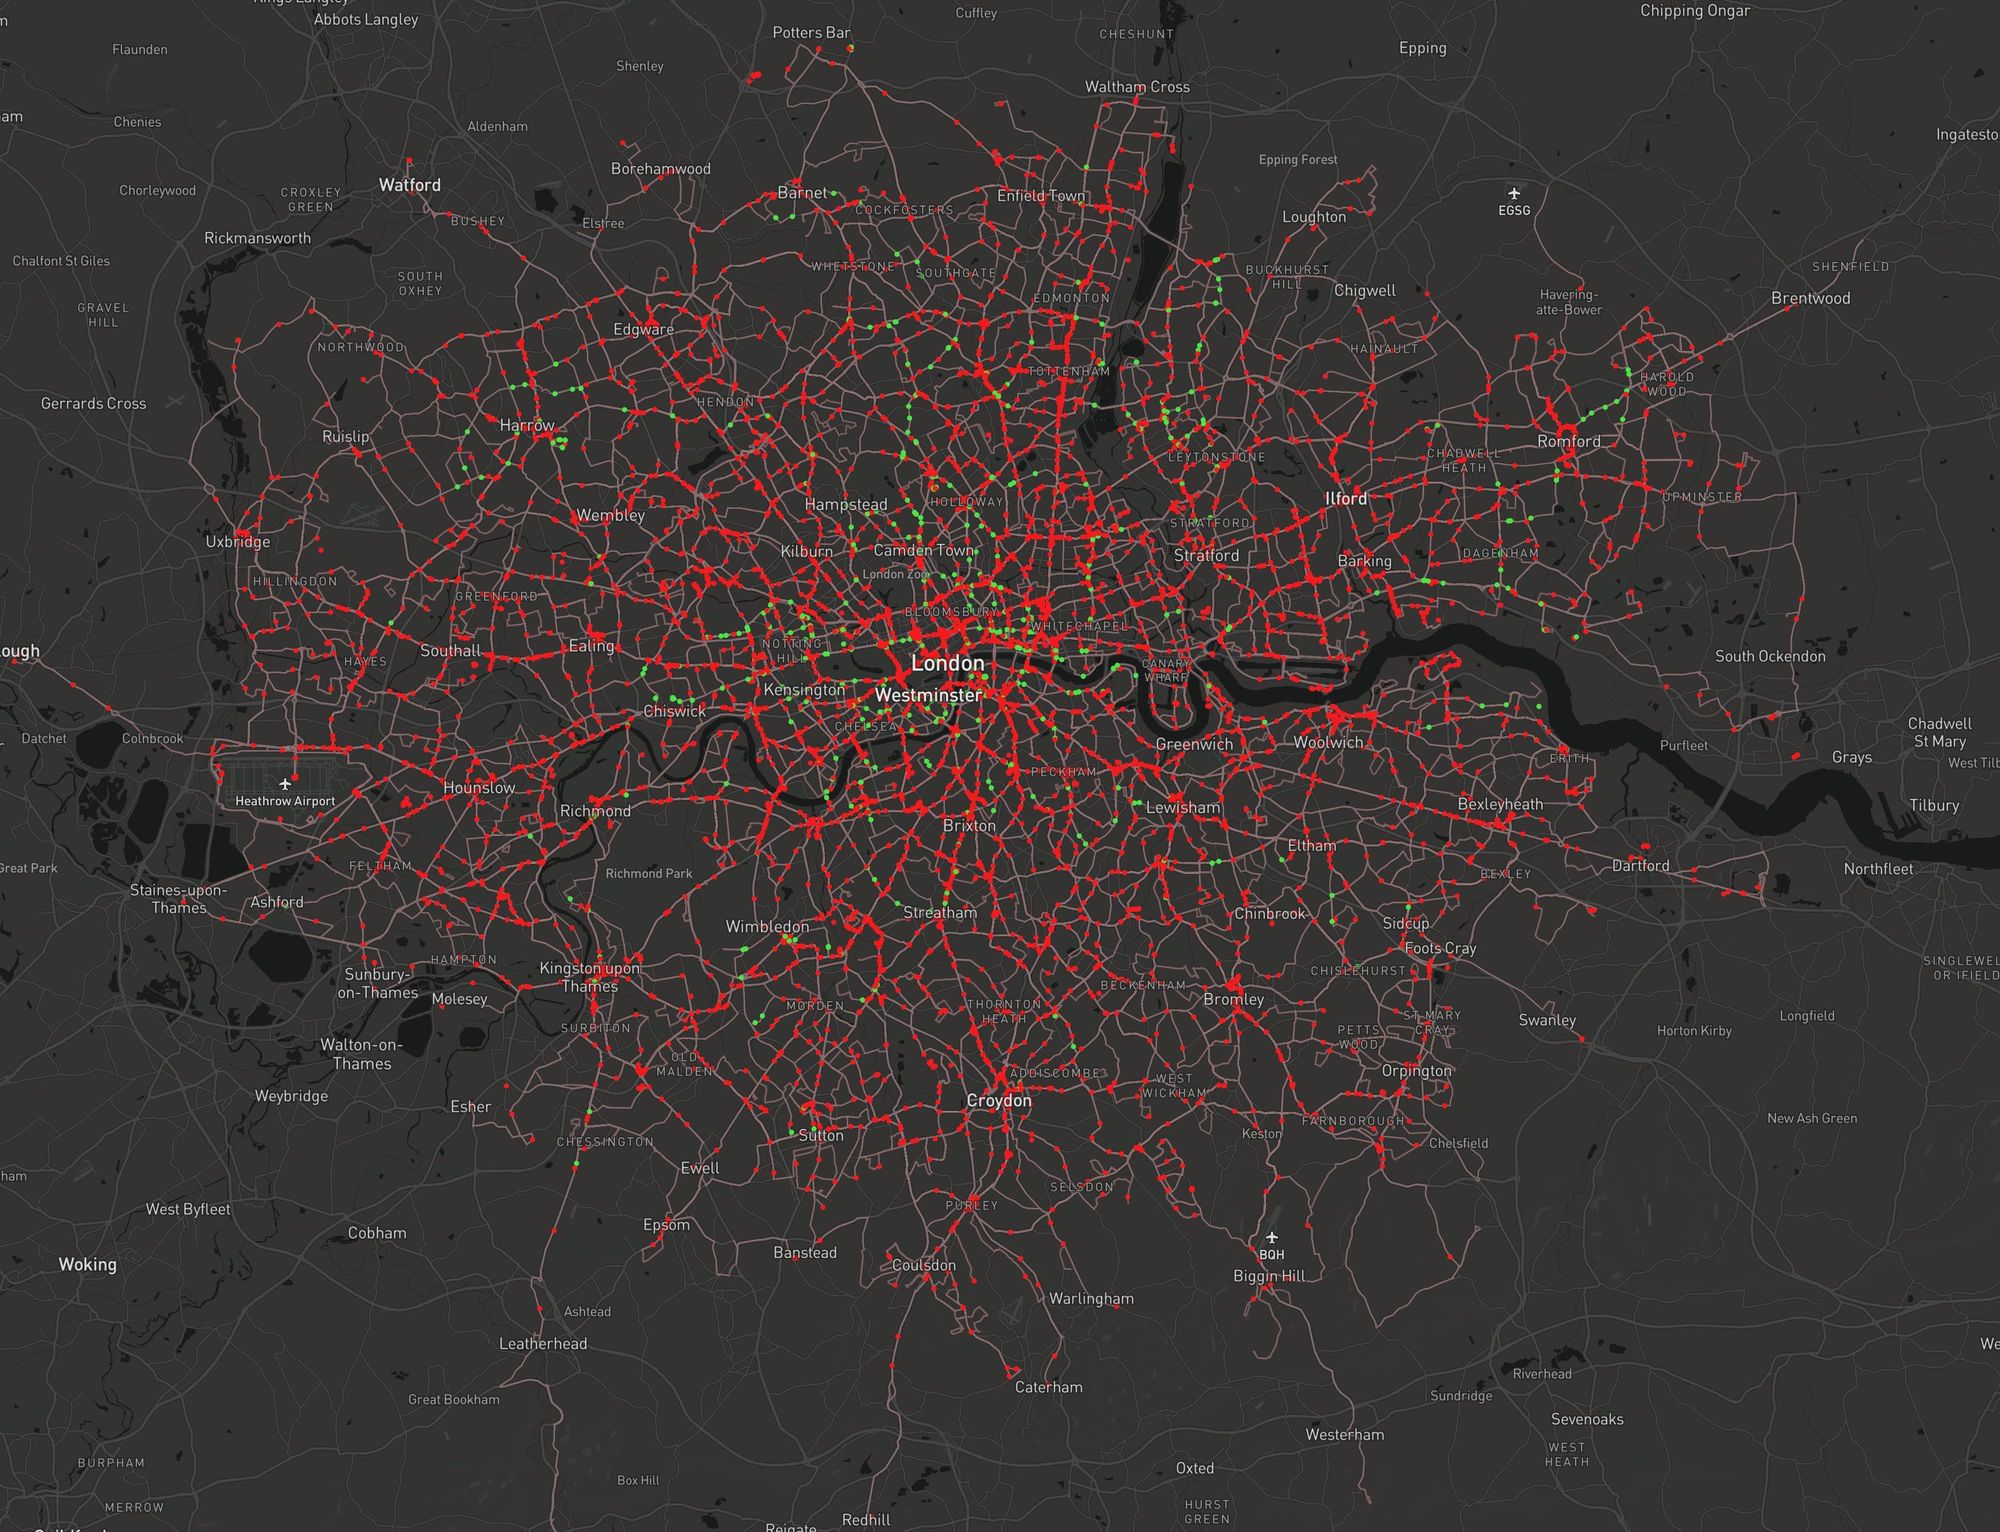
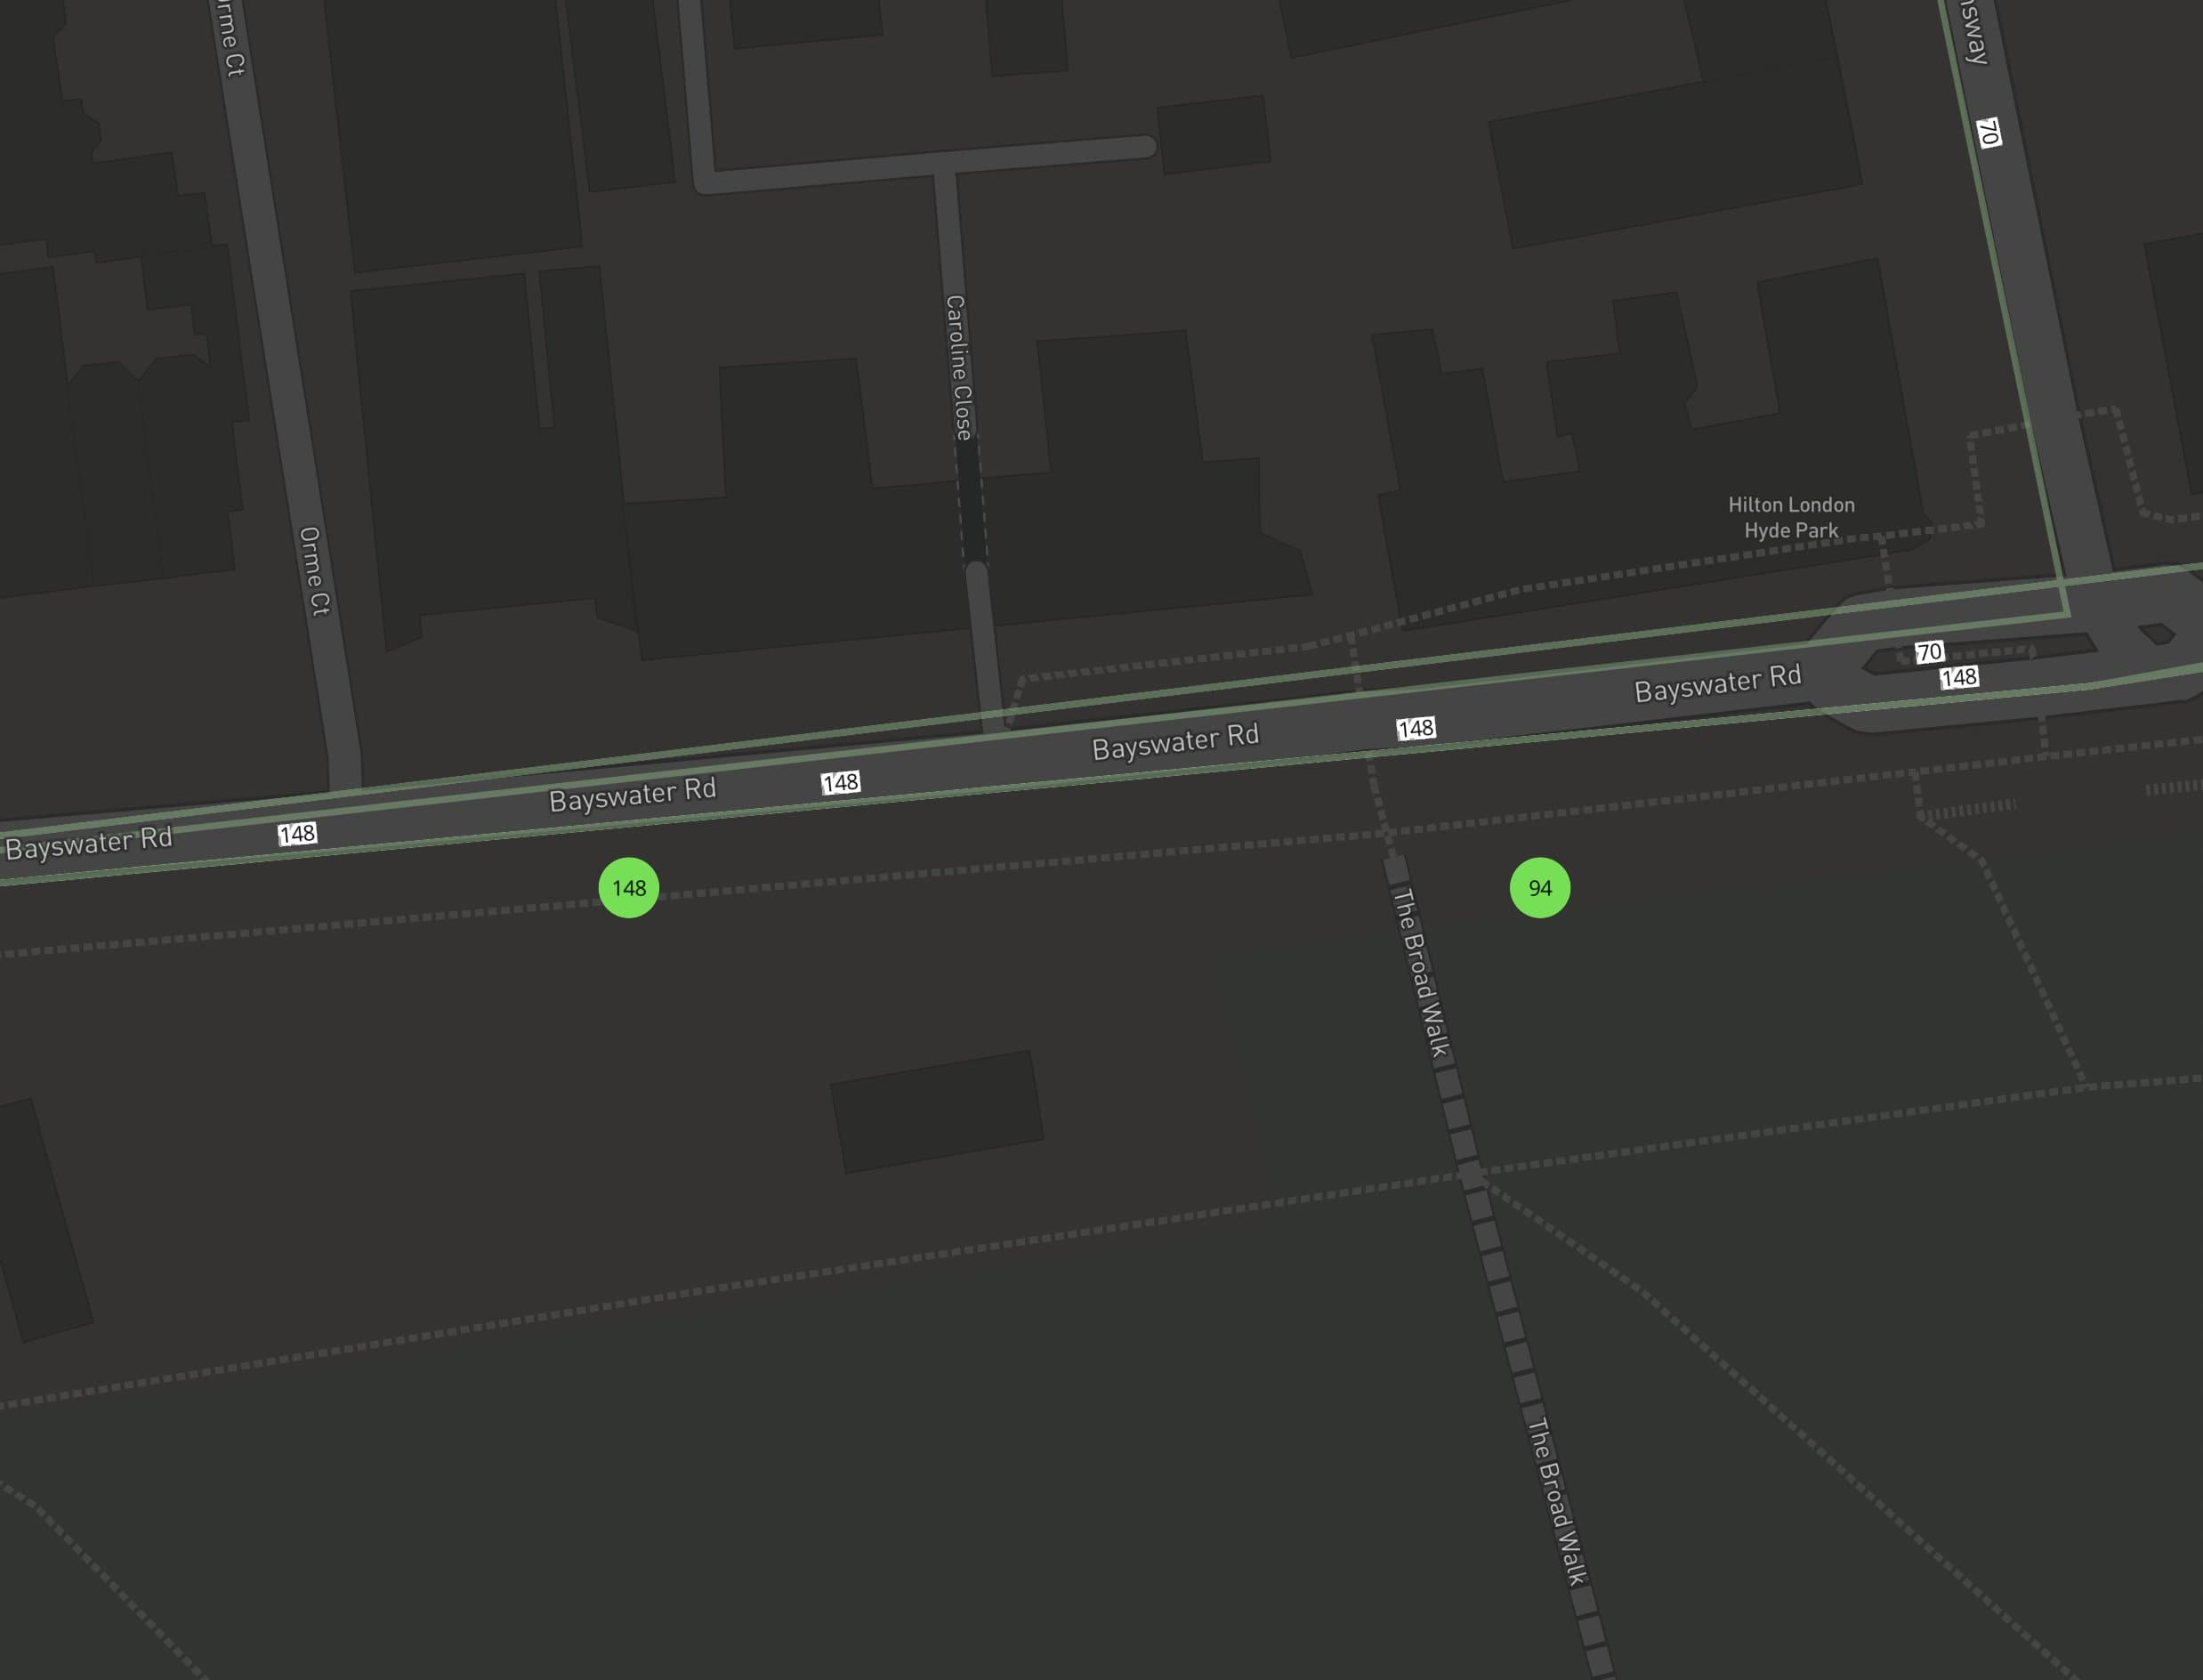
The map was made using Mapbox GL JS and the data was taken from a variety of sources, along with a bunch of custom processing:
- Live bus positions are from the Bus Open Data Service API
- Bus route geometry is from the TfL route sequence API
- Majority of electric buses come from the TfL bus fleet audit
- Missing electric buses are found using the DVLA Vehicle Enquiry Service API
Most of the time was spent working out which buses were electric as not all of them are included in the TfL bus fleet audit, as it’s only released once a year and it’s already a few months out of date by the time of release.
Fortunately the DVLA Vehicle Enquiry Service can be used to query a vehicle number plate and get limited information about the vehicle, such as the type of fuel used (ie. diesel or electric). This allowed for a number of electric buses to be detected that weren’t included in the fleet audit.
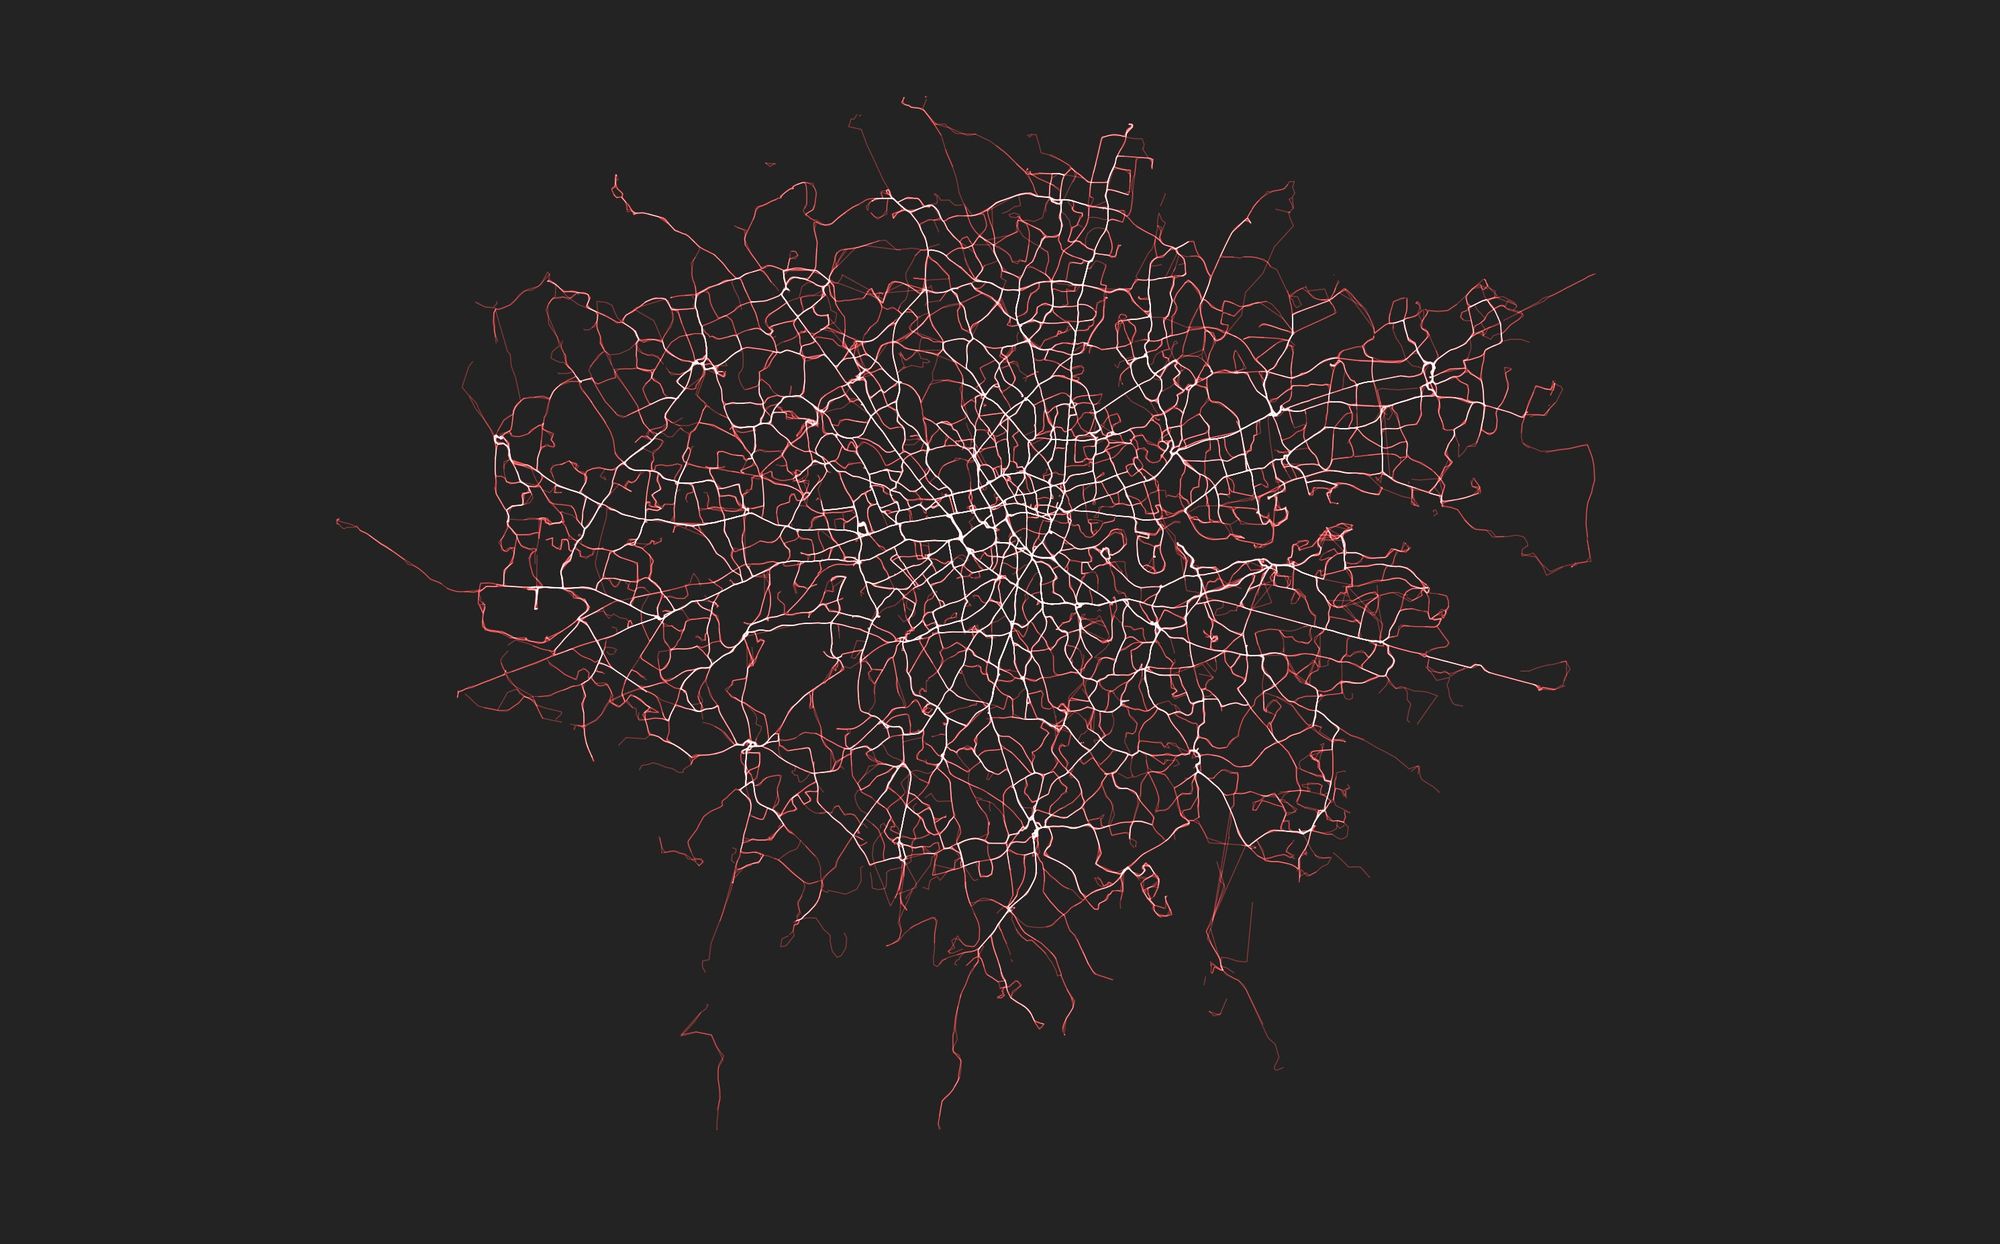
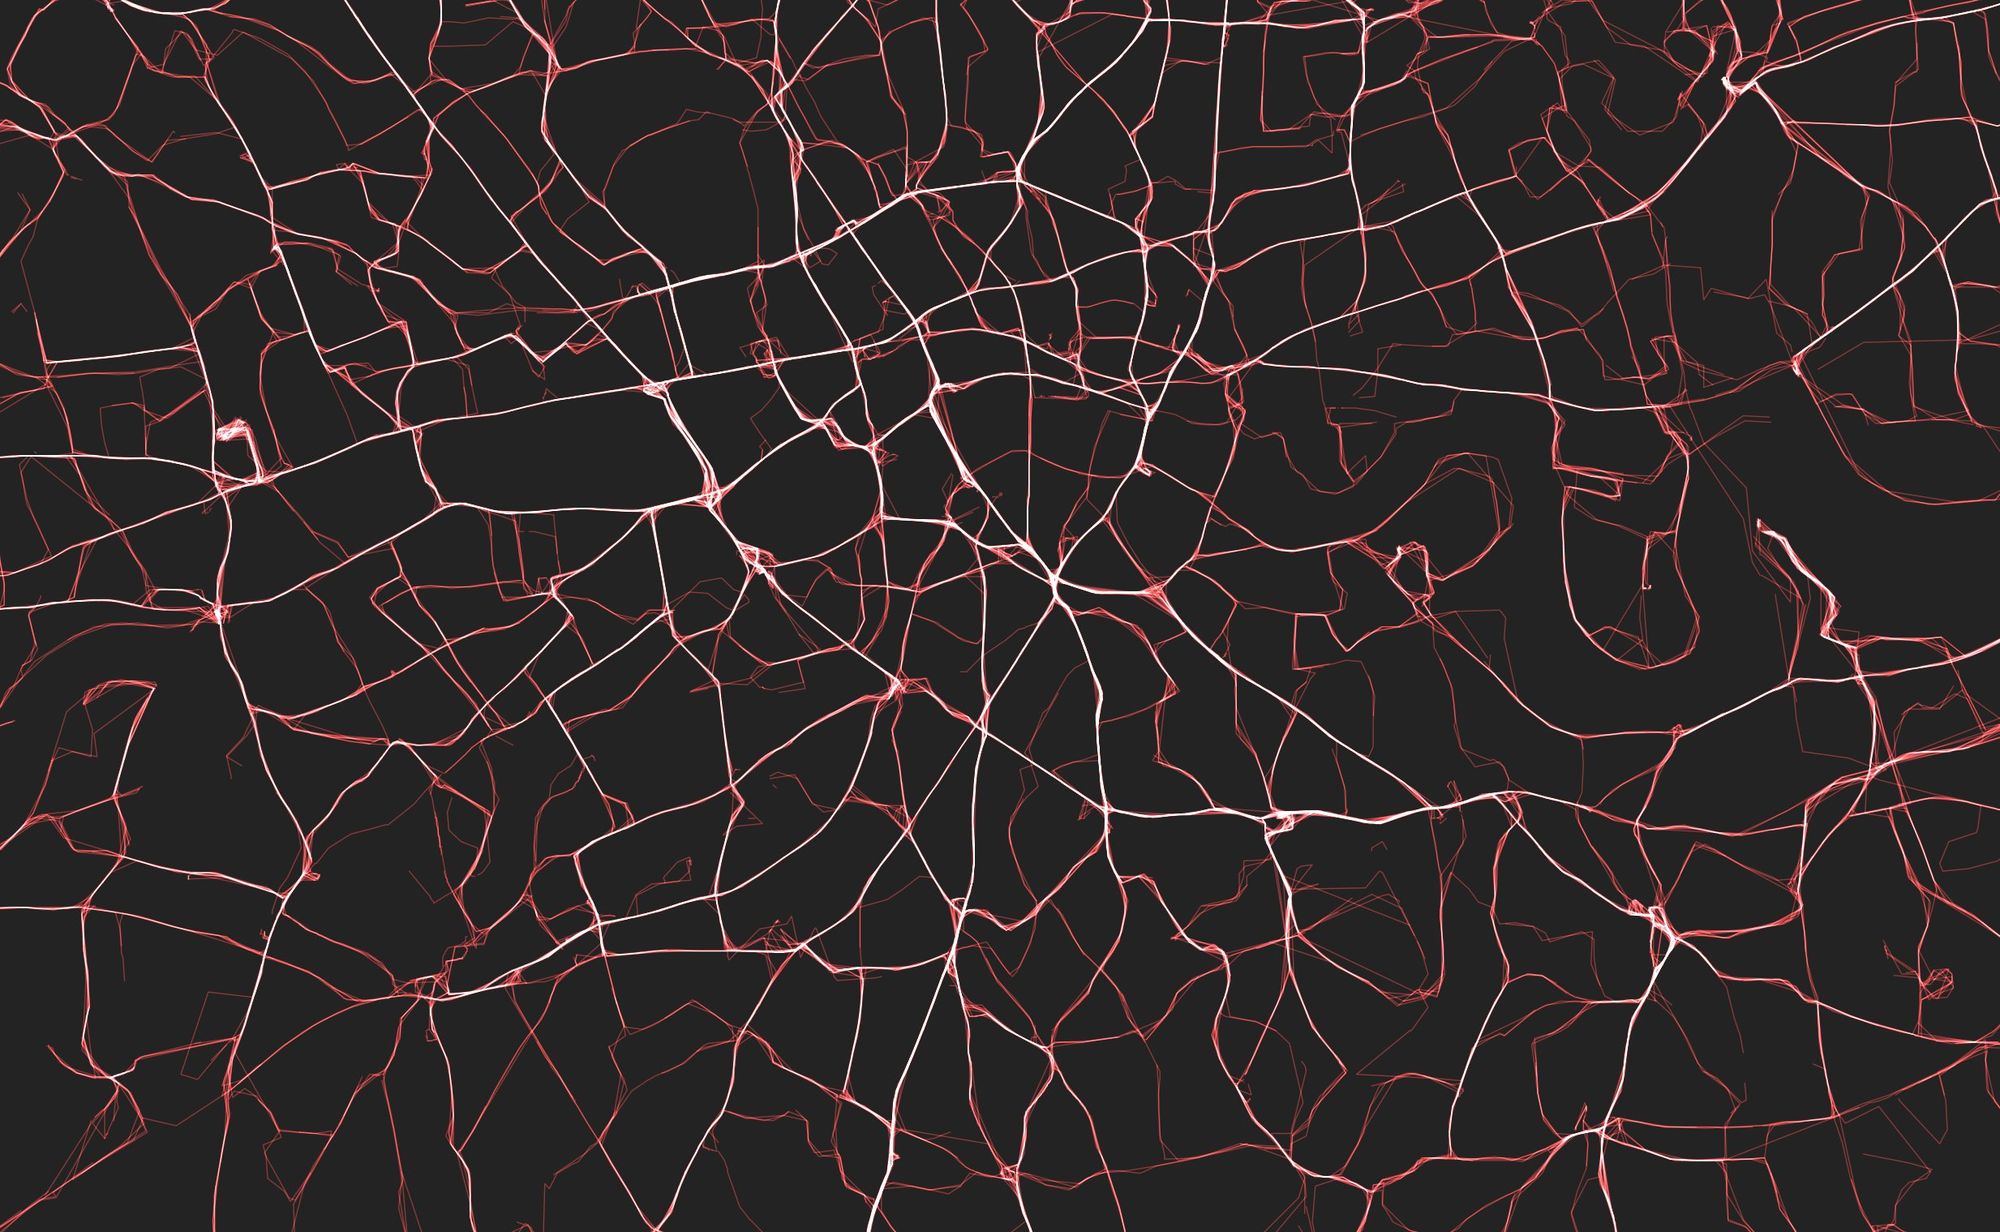
I also spent some time looking at supplementary analysis and visualisation of the bus data and using it as an excuse to experiment with various Python and data processing tools that I’ve wanted to try out.
One particularly interesting visualisation resulted from plotting the location of each bus in London over a period of 15 minutes. There are so many buses in the city that 15 minutes was more than enough to trace out a recognisable outline of the major road network and the city as a whole.
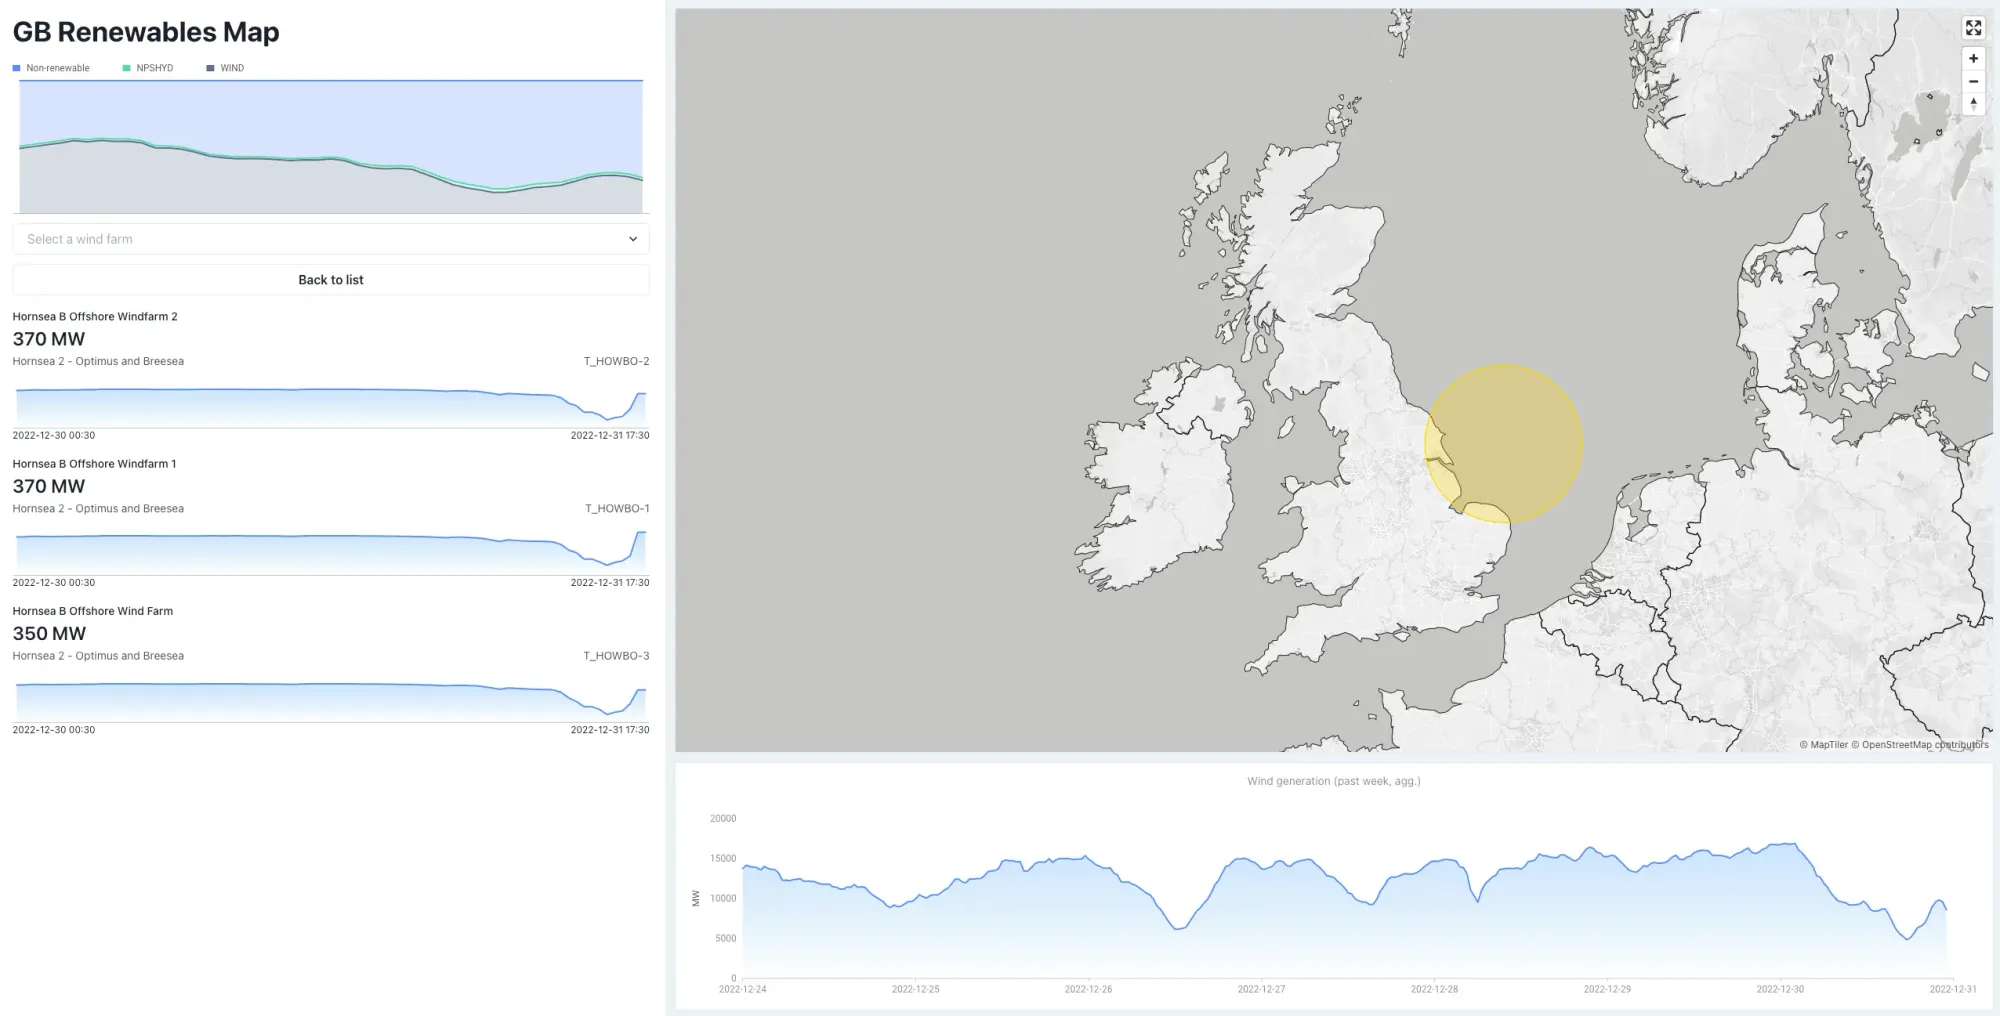
Live map of wind generation in Great Britain
Towards the end of the year I started work on a project to plot live and historic generation data for wind farms across Great Britain.
A big part of this was learning about Balancing Mechanism Units (BMU) – the smallest tracked components of the electricity network (eg. a wind farm substation) – for which you can retrieve generation data using public APIs.
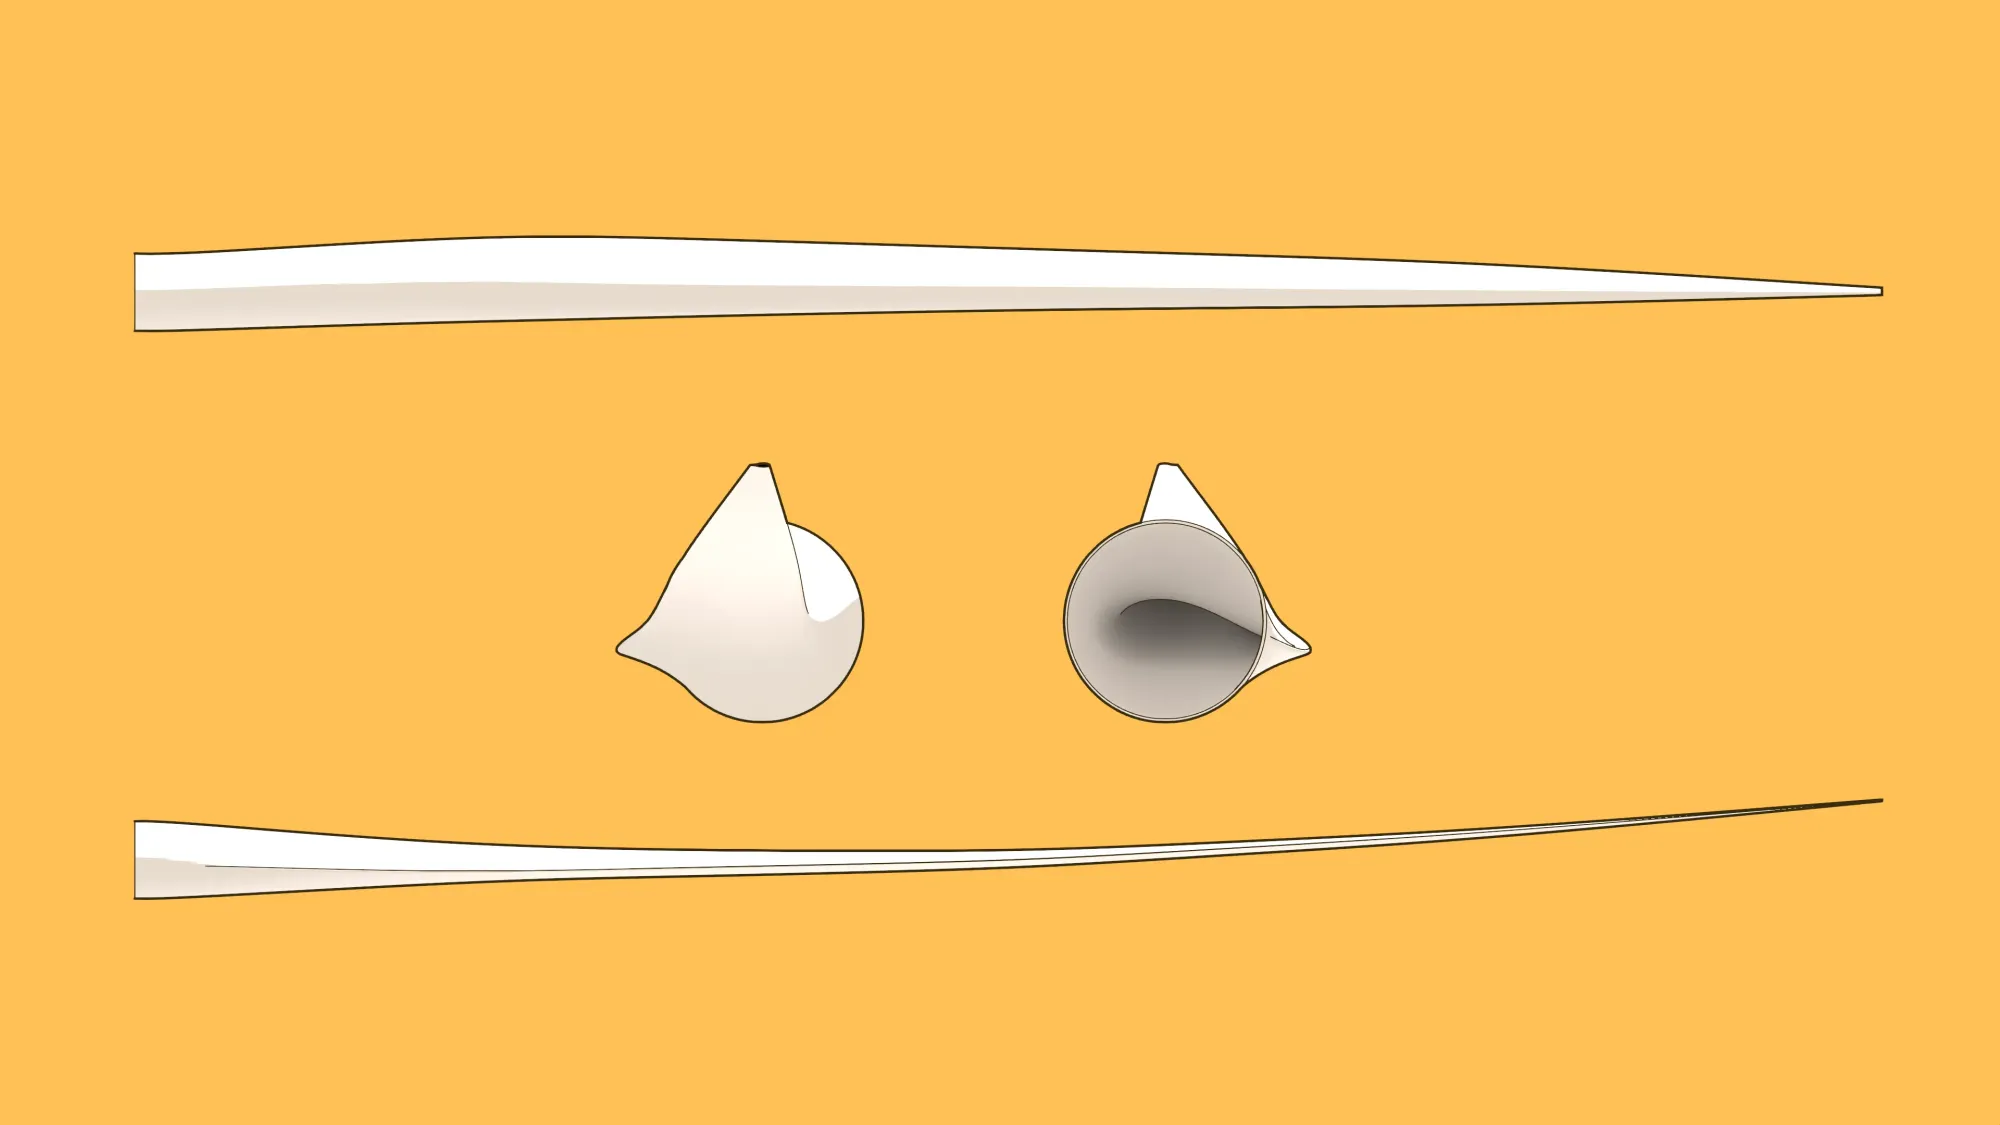
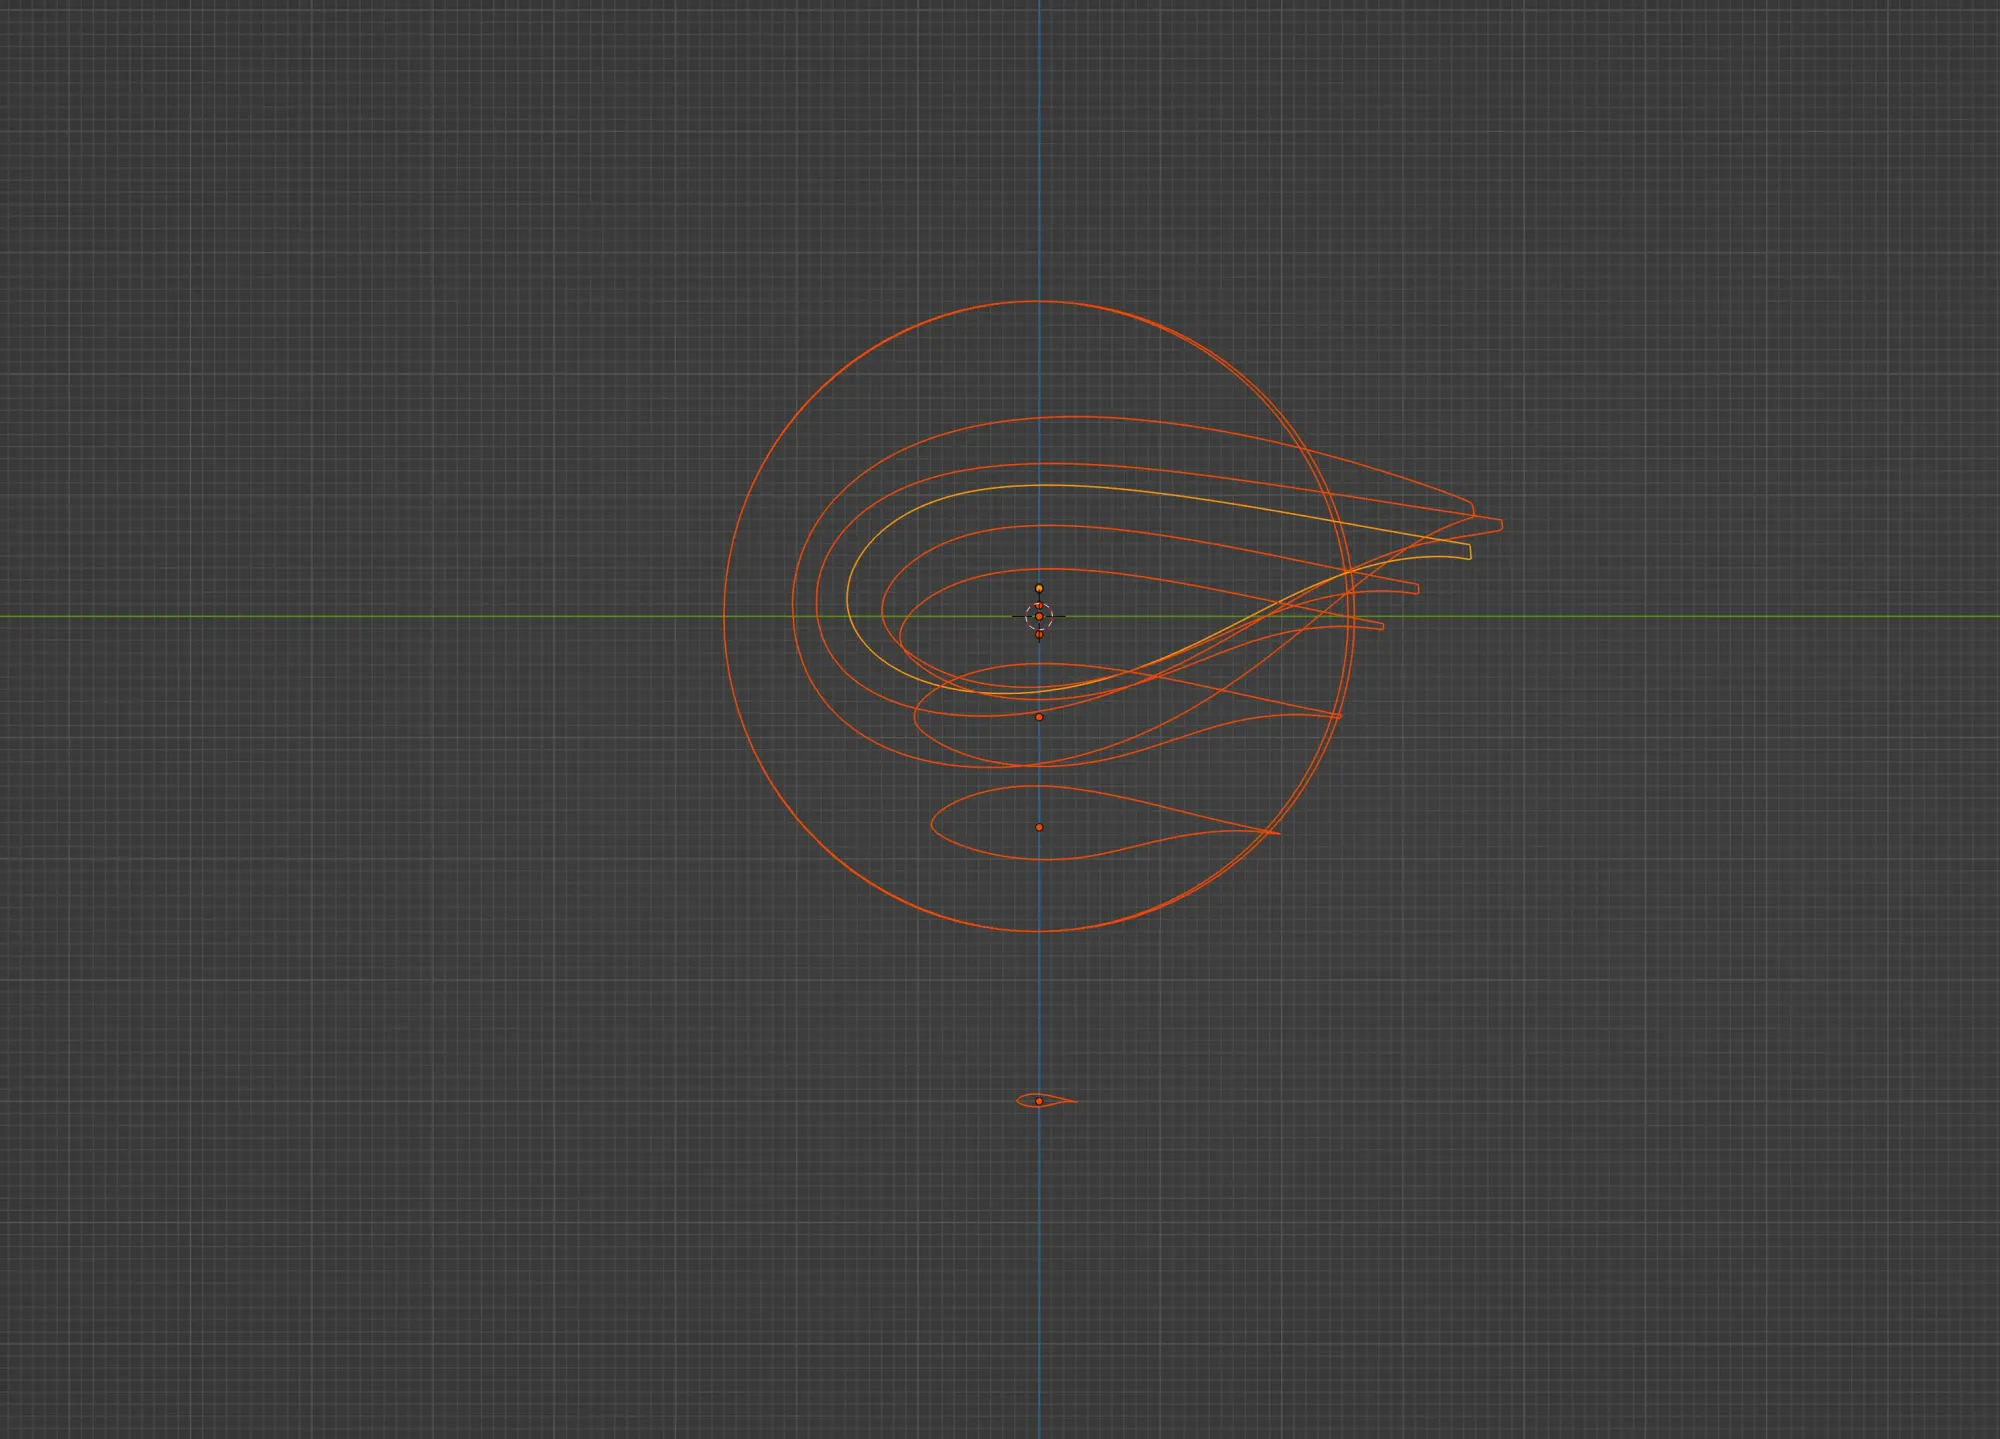
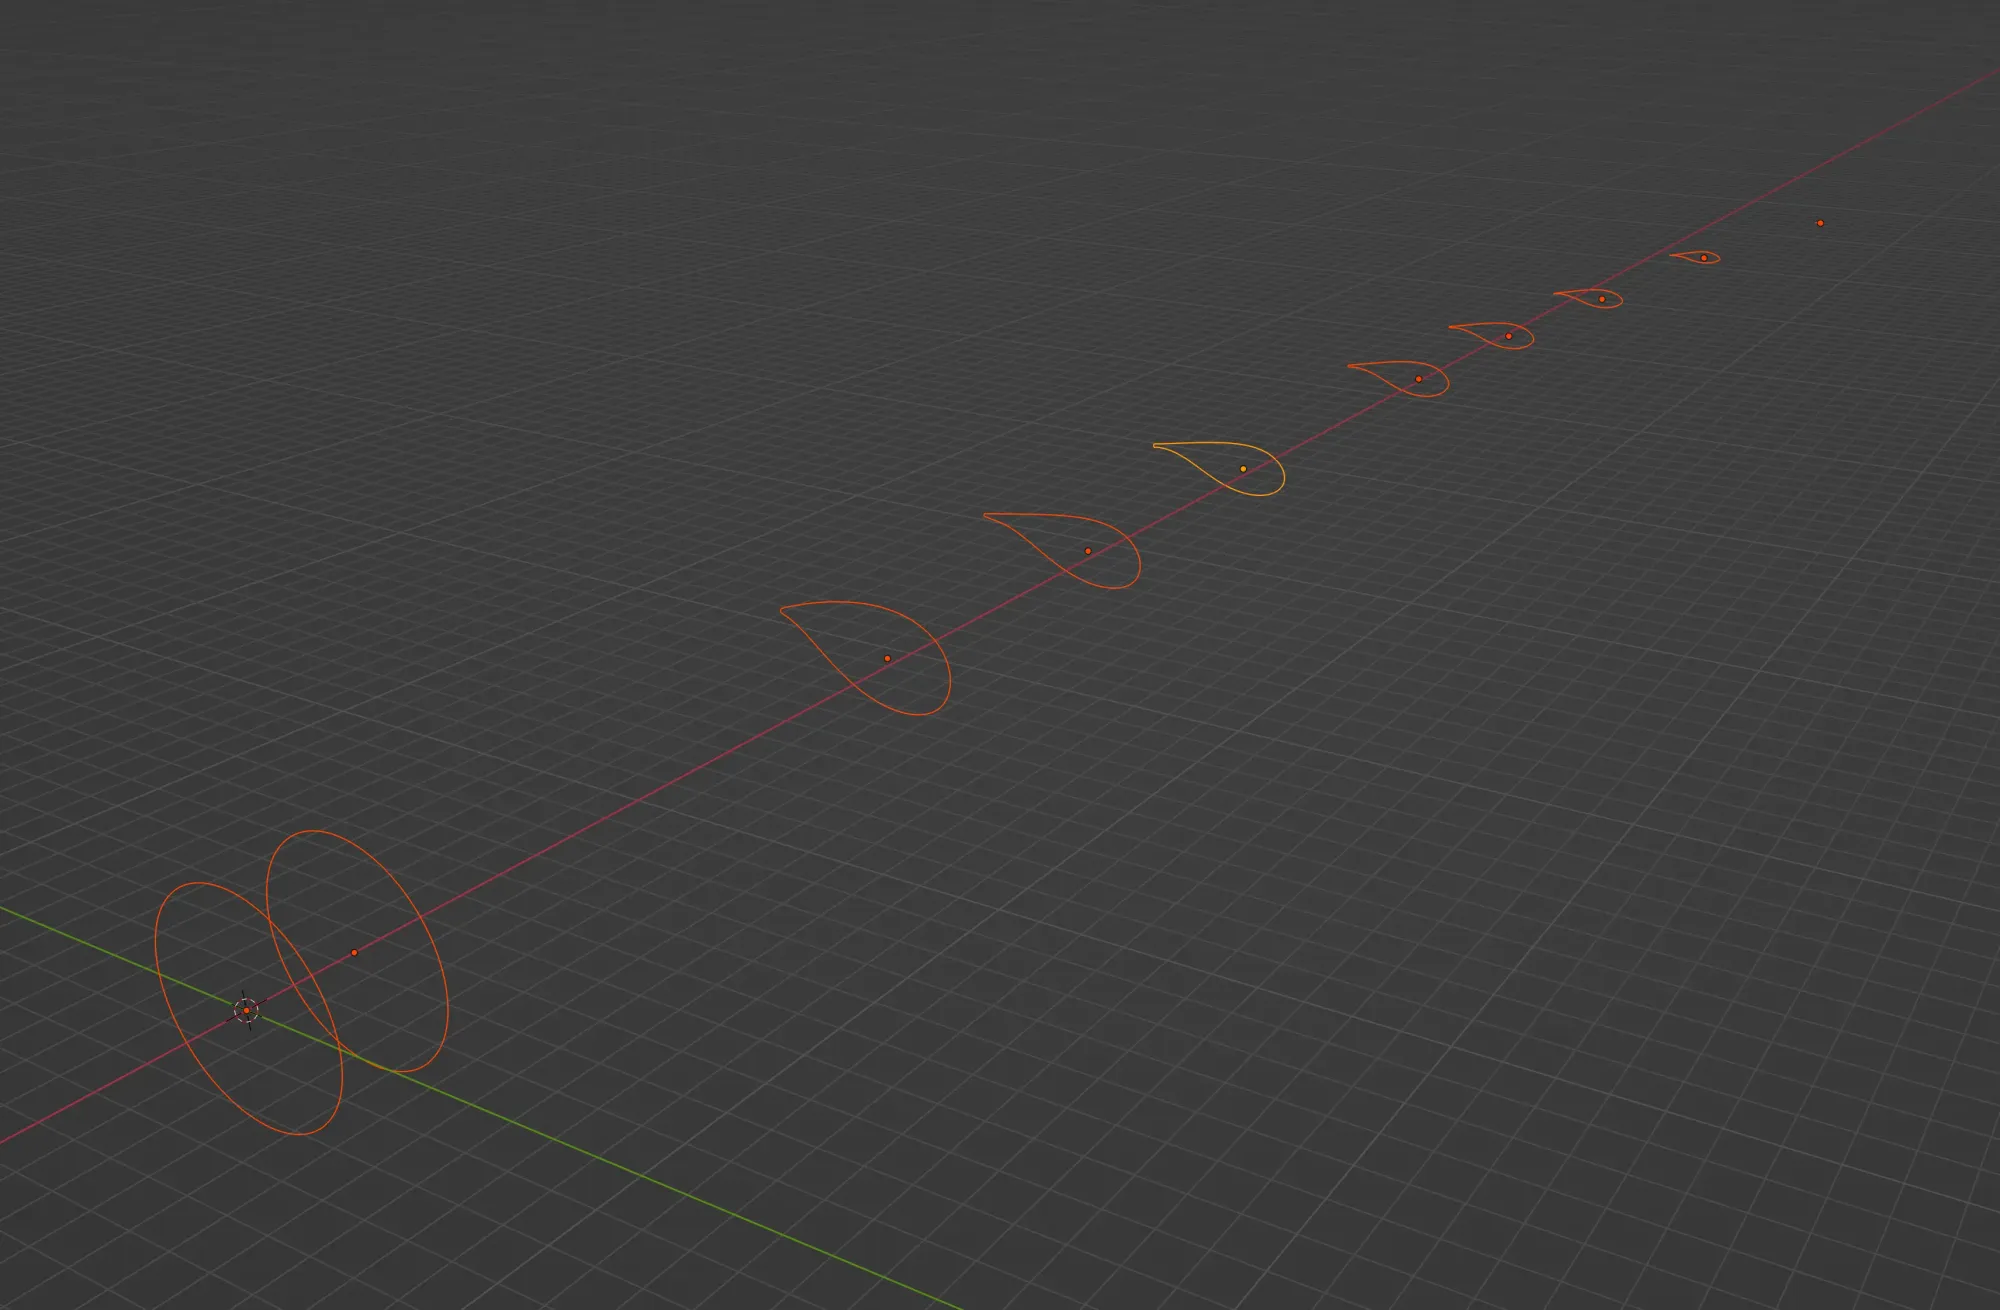
Accurate wind turbine blades in Blender
The last project of the year was learning how to create wind turbine blades in 3D using Blender. These are created using actual airfoil profiles similar to the ones used by real wind turbines.
The result is a much more realistic model that ends up taking much less time to produce than if trying to make the models by eye. It also means that any wind turbine blade can be turned into a model in very little time, assuming the airfoil profile data exists.
Other things I’ve done
This year hasn’t been spent solely on flashy visualisations. Much of my time has been spent learning about various related things or working on projects that aren’t quite as visible.
Learning as much as possible about renewable energy and the energy transition
Alongside learning about BMUs, I’ve been spending much of the year researching and learning about various aspects of renewable energy and related technologies. I still have a lot to learn but it’s starting to piece together.
I also have a funny feeling that Elen is quite bored of me talking about it and constantly spouting random facts about wind turbines and their individual quirks and capabilities as we come across them on our walks.
But seriously, I’m absolutely obsessed with future energy technology and haven’t felt this excited to throw myself so deeply into a new domain in quite some time.
Investigating how to communicate the energy transition in a way that makes sense to the general public
If we expect people to give a shit about renewable energy and the change they can enact from home, then we need to find better ways to communicate these topics and their complex terminology.
What’s the difference between a kilowatt and a kilowatt-hour? What’s the difference between power and energy? Are all wind turbines the same? How can we use renewable energy at night when it’s not windy? How much electricity can I expect to generate from solar panels if I put them on my roof? How does an air-source heat pump work?
There are so many topics and questions that need better methods of communication and visualisation, and this is exactly what I’m spending most of my time looking into both at work and with my personal projects.
Improving my Blender skills
Another general theme this year has been the gradual improvement of my experience using Blender. It’s such an incredibly powerful tool and I’m particularly excited to explore the more recent additions such as Geometry Nodes, which will prove useful for procedural generation of models.
Using more Python for data processing
I’ve always wanted to do more with Python as it’s effectively the programming language for data processing. Fortunately I got to spend a lot of time this year working with Python and exploring many of the data processing and visualisation libraries that I’ve had on my list (Dagster is a particular favourite).
I’m definitely not as comfortable using Python as I am with JavaScript, though I’d certainly say that I’m now sufficiently familiar with it to use it for my needs.
Exploring DuckDB for data analysis
One of the most interesting technologies I explored this year is DuckDB, an in-process database management system that allows you to perform complex data analysis using SQL without having to set up and configure a database.
What does that all mean? Well for me the draw is that I can quickly perform complex analysis on static files (such as Parquet) without having to set anything up. The best bit is that it’s also insanely fast and has so far proven to not only be quicker to start using, but also quicker to run queries too!
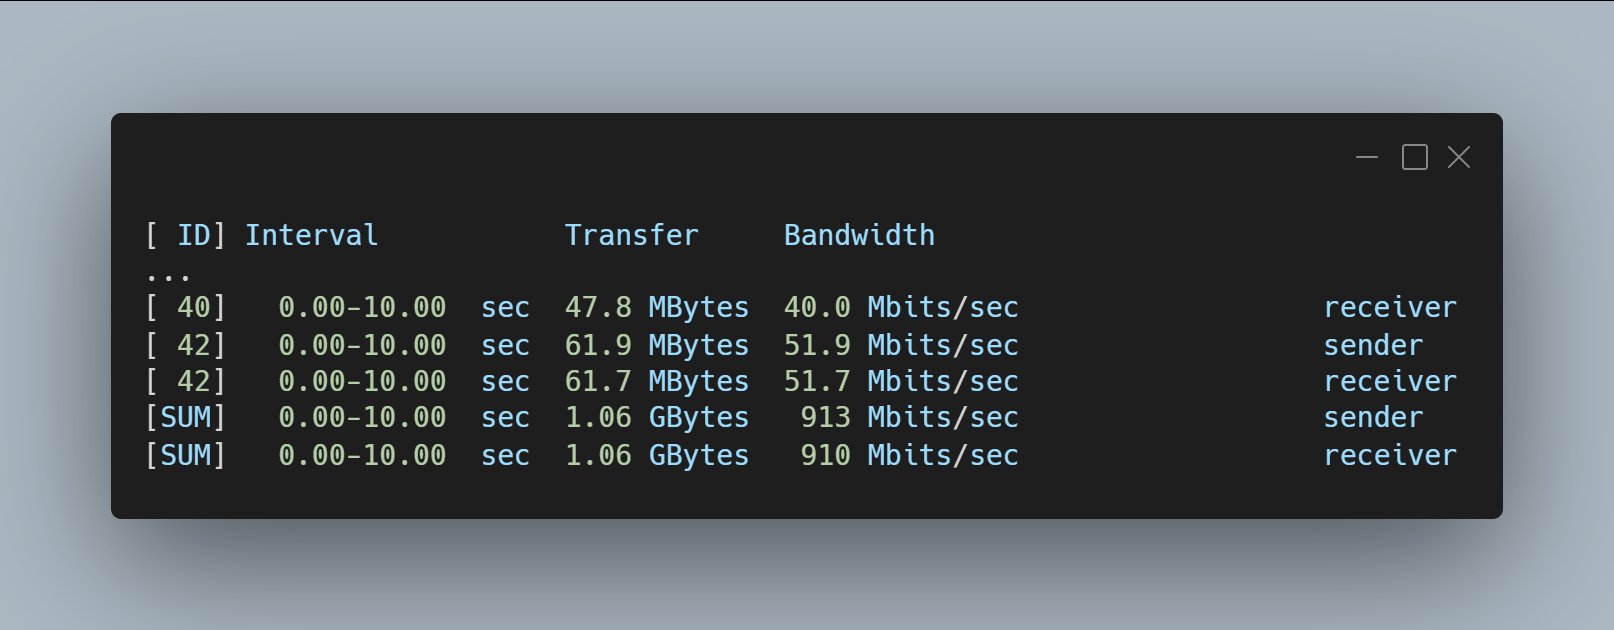
Supercharging my home wireless to gigabit speeds
I’ve been struggling with my wireless network performance ever since I upgraded to a gigabit Internet connection at home. The gist of it is that my Internet speed is significantly faster than the wireless throughput I was able to get on my local network using previous-generation wireless technology.
As an aside, it’s kind of crazy that we’re now at a point in history where your connection to the Internet can be significantly *faster *than your local wireless network.
Anyway, the solution to all this has been two-fold:
- Upgrading to a beefy WiFi 6 (802.11ax) router to allow for local wireless throughput greater than my gigabit Internet speeds
- Buying a second WiFi 6 router to use upstairs in a bridge mode, connected to my computer using Ethernet and to the main router wirelessly
Taking my personal finances more seriously
Considering I’m 36, I’m a little embarrassed to admit that I only started to take my personal finances seriously this year. You know, things like pensions and savings and all that important stuff you should probably have under control. My savings used to sit in a standard bank account with zero interest – not clever.
I’m still completely new to the concept of stocks and shares, though I’m slowly gaining more experience with it. I’m also shockingly bad at it, somehow picking the absolute worst possible time to invest my savings. No doubt it’ll work out in the longterm, though it’s certainly off-putting to see your savings worth less than when you started, even if it’s only temporary.
Fortunately I was wise enough not to put everything into the stock market and instead kept a portion of my savings in easy access savings accounts that have provide decent interest. I found the recommendations on Money Saving Expert incredibly useful to ensure that I have a savings account with the best interest rate, especially as the rates are changing nearly weekly at the moment.
Nailing how to make a decent espresso
During the first covid lockdown I bought a home espresso machine (a Sage Bambino Plus) to learn how to make better coffee at home. The initial results were good, though it was only this past year that I really started nail down how to make a coffee that I consistently enjoy.
I’ve found it surprising how important it is to be precise about grind size, measurements and technique, and how different the taste can be if you get lazy about the process.
It’s also turned into a bit of a daily ritual and something that I look forward to as a way to structure my day and take a break from the computer and reset my brain. They aren’t cheap, though I highly recommend one if you want to make better coffee at home – it’s one of our favourite purchases in recent years.
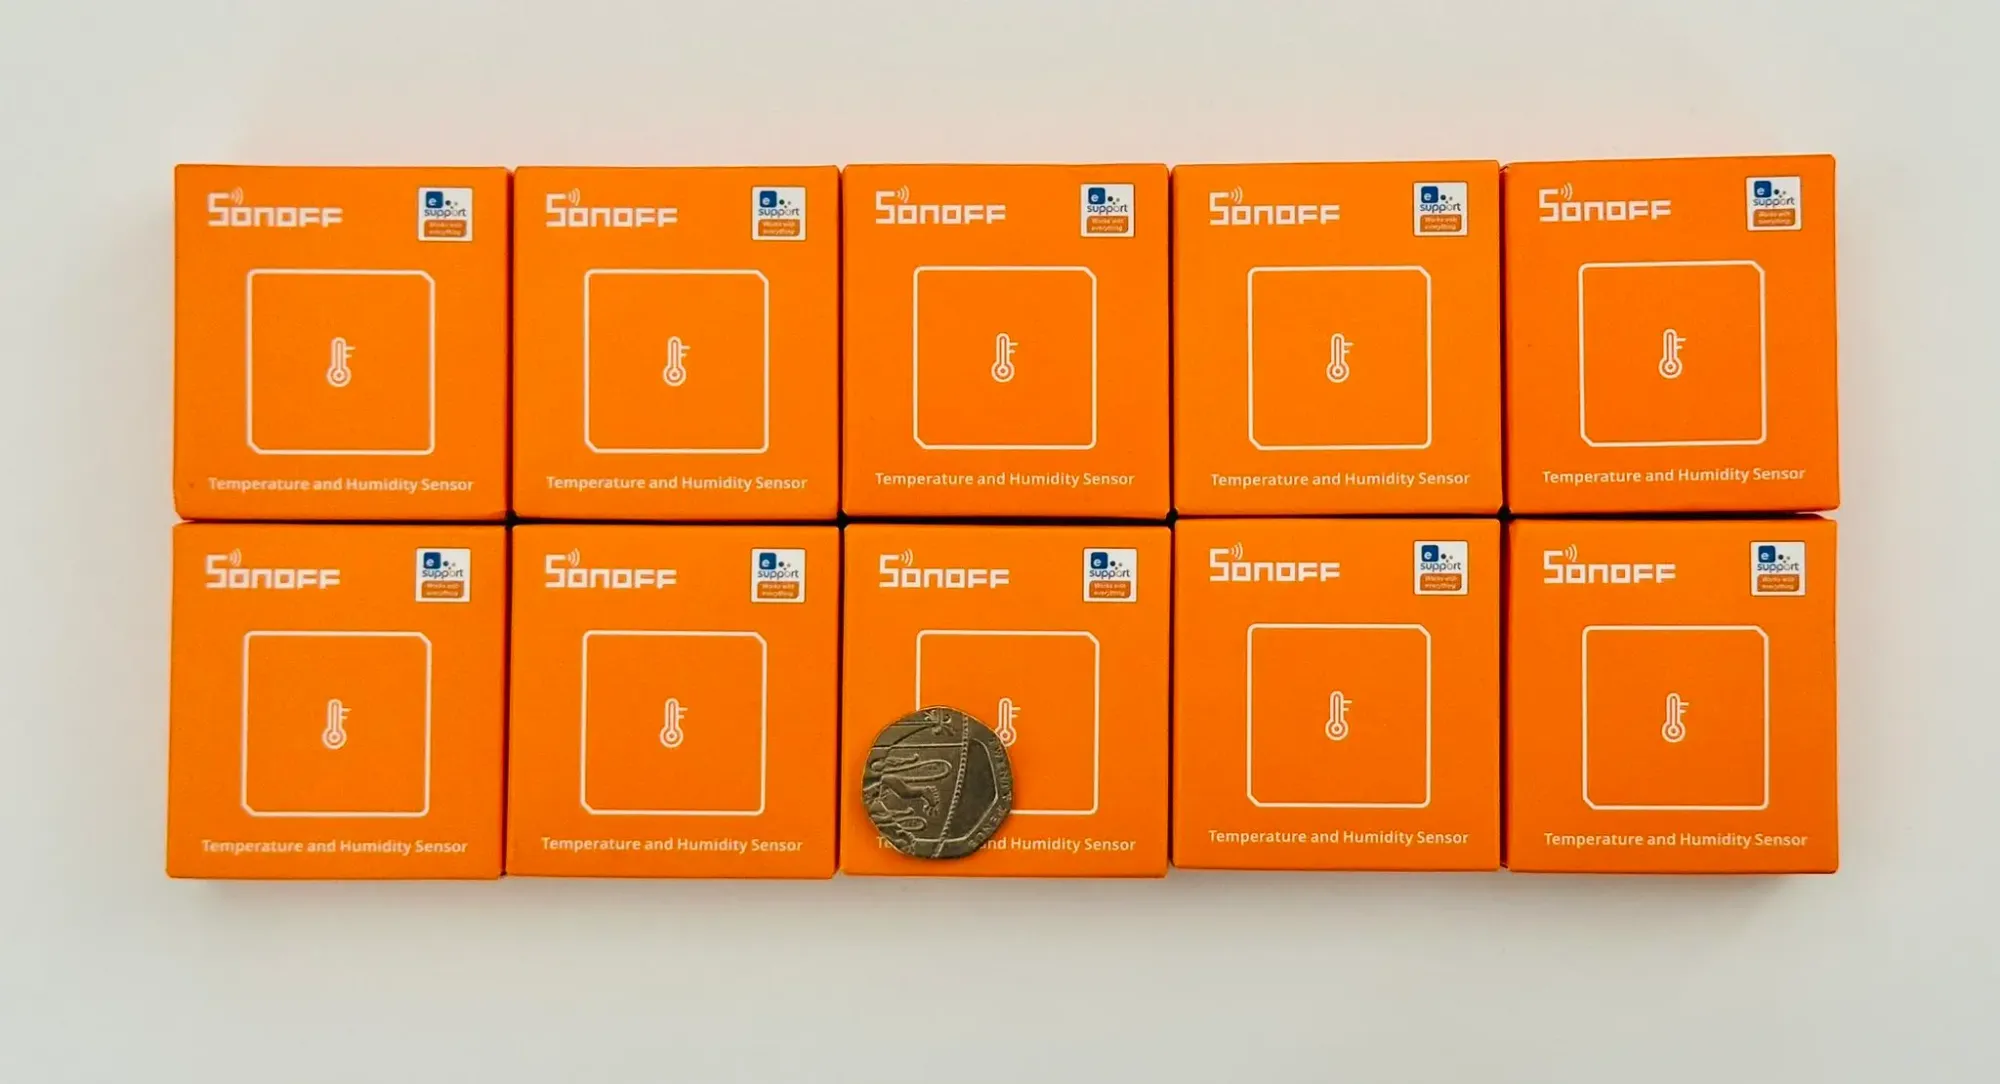
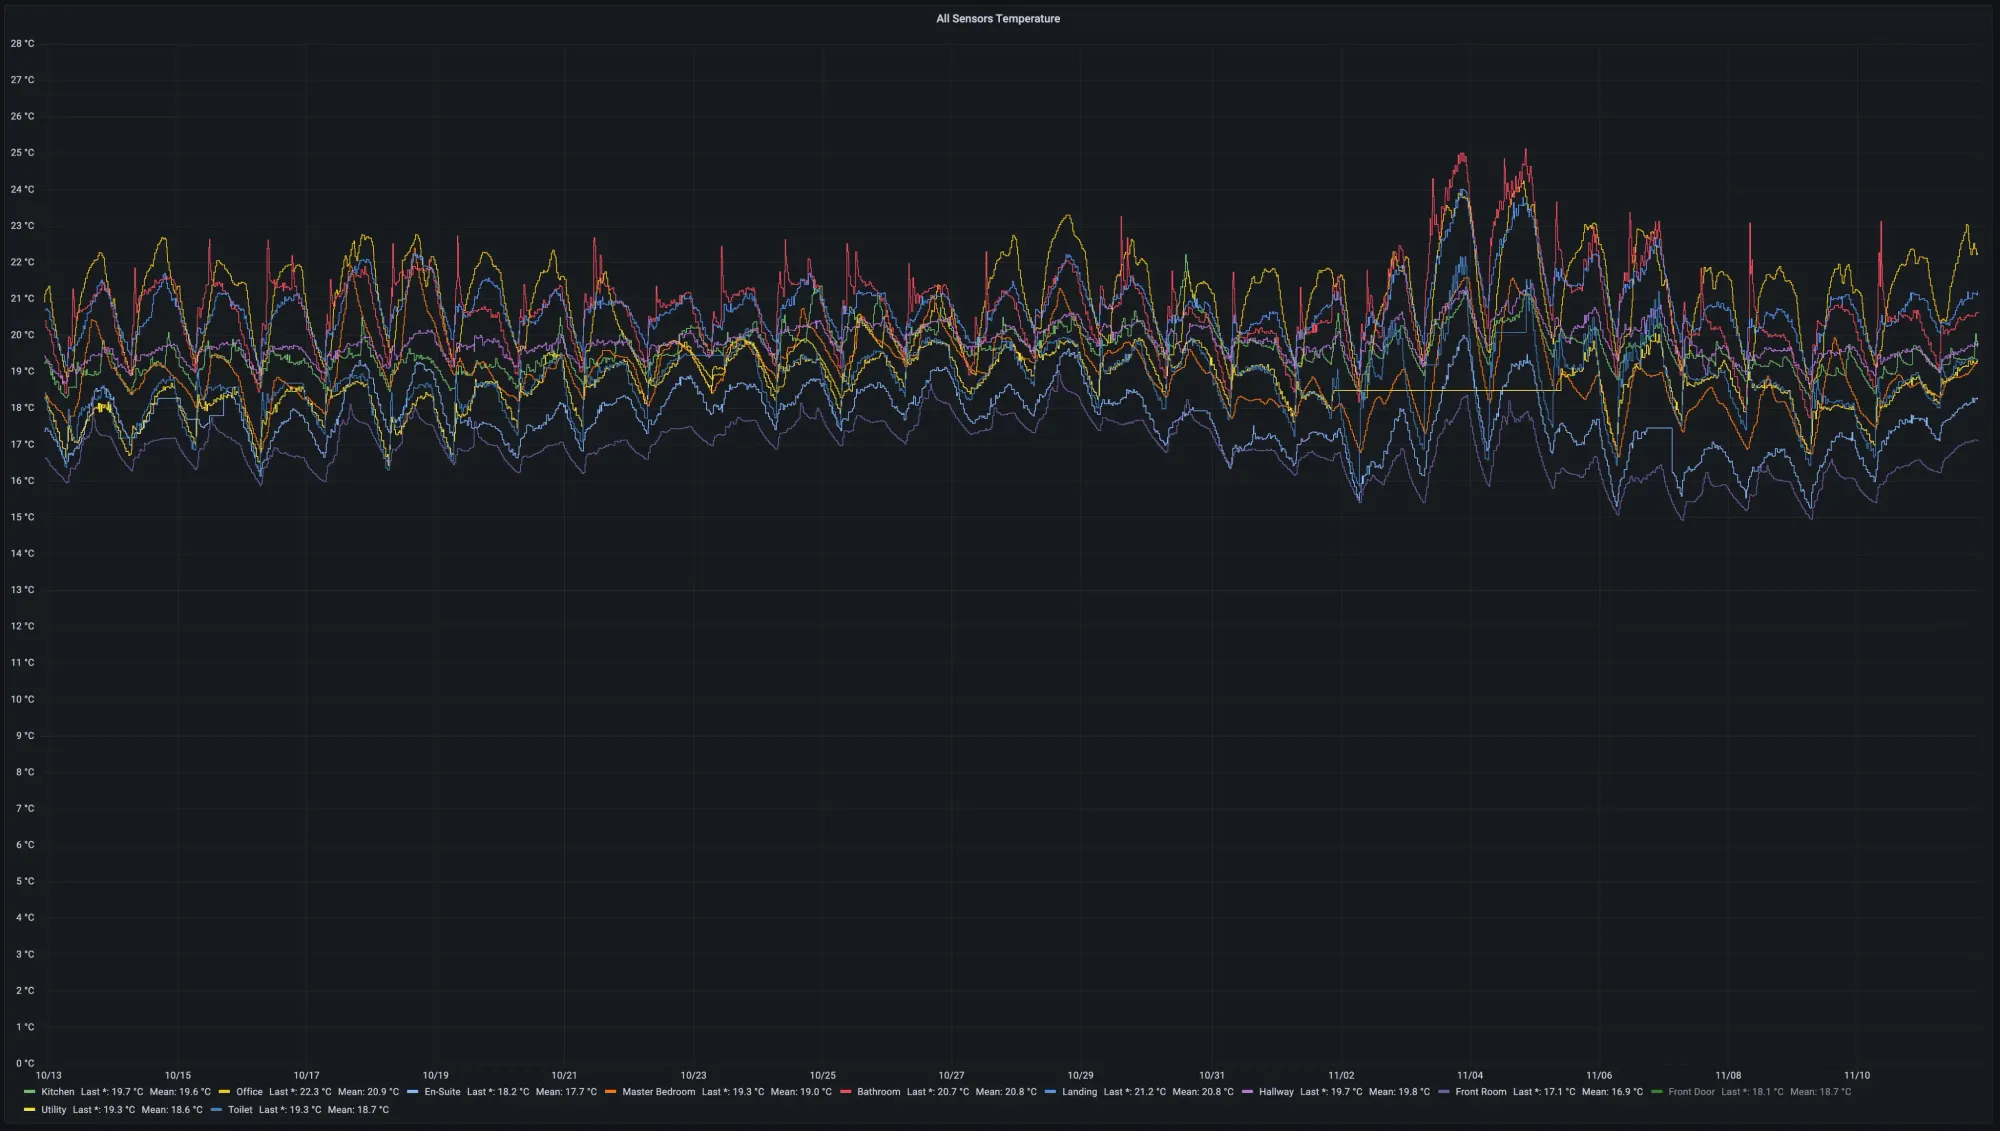
Tracking home energy and reducing gas usage
Earlier in the year I started tracking my energy usage using Home Assistant, an operating system for home automation and data analysis. I had an old Chromebox lying around so I flashed it with Linux and installed Home Assistant on it.
I started out simply tracking my electricity and gas usage using a local MQTT feed from the smart meter (using a Glow Display & CAD) and it quickly expanded to tracking the power consumption of individual devices using programmable smart plugs.
Switching back to Mac
Windows has been my go-to operating for a few years now and I’ve had no reason to switch from it, especially as it means much cheaper hardware that can be upgraded without buying an entire new PC.
However when I joined Octopus I was given a fancy MacBook Pro that uses the new ARM processor, so I was interested to see how things had changed on MacOS since I last used it. Let’s just say I was pleasantly surprised (the thing is *silent *even under load) and when the new Mac Studio desktops were released I promptly snapped one up as my main personal machine.
The Mac Studio is a beast and I love it. It’s tiny (way smaller than a PC tower) and it’s absolutely silent under all but the heaviest workloads. Even then it’s barely perceptible in comparison to the “silent” fans on my desktop PC.
I’m still a little unsure about getting caught up in the Apple ecosystem again (and the extra expense), though I have to admit that it’s a much slicker experience. The recent OS updates across the Apple devices have also introduced some really cool features, like using Sidecar to turn your iPad into a drawing tablet for the Mac.
Setting up a new home on Mastodon
Something I hadn’t anticipated this year was the situation with Twitter, a service which I use extensively for my personal and professional network. Pretty much my entire career is documented on Twitter and many opportunities in my career have happened as a direct result of using it.
It’s safe to say that the chaos toward the end of the year was a little worrying, especially as I rely on Twitter so much. If anything, it helped realise just how much I rely on a single social network and how much I would lose if it was to disappear.
Fortunately I’ve since been able to grow a half-decent network on Mastodon and you can find me on the Fosstodon instance. It’s been a blessing in disguise as the community on Mastodon has been so refreshing and has shown me just how much Twitter has lost its way for building meaningful relationships with people, even if it is still useful professionally.
I’ll still be using Twitter, though I’ll also be starting to post more things on this website and other places that are under my control. I feel like we’re moving back toward the early days of the Internet and I’m here for it.
Travel and photography
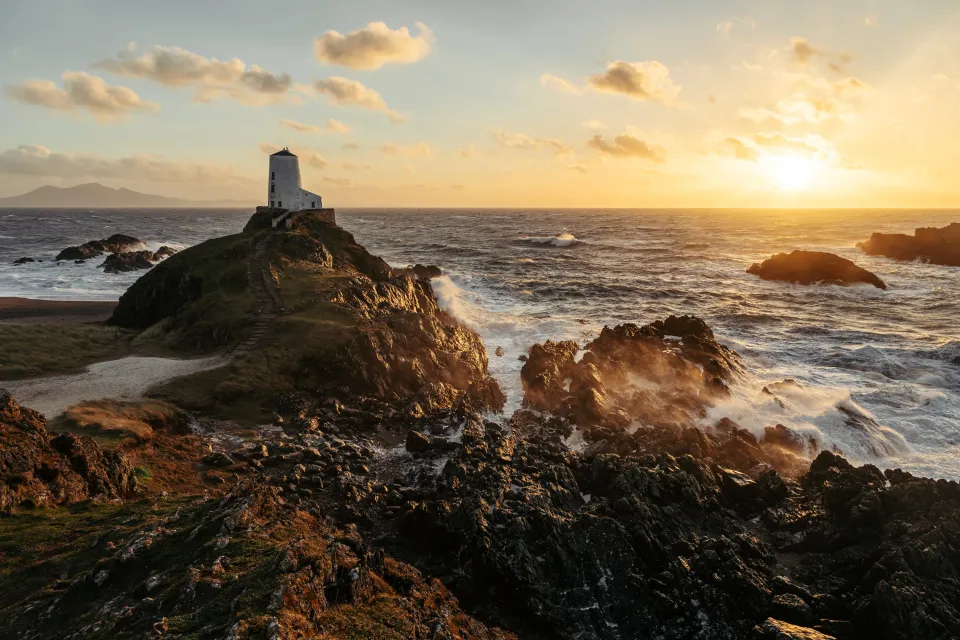
There were no massive trips this year, mostly staying within the UK. Then again, why travel so far away when you have the glorious North Wales landscape on your doorstep?
I also took some of my best photos this year, which is sort of a surprise as I haven’t been actively trying to do anything different. I think it’s a combination of persistence and getting lucky with the conditions, and perhaps me getting better at processing my photos in Lightroom to an edit that I’m happy with.
Edinburgh, Scotland
Our first major trip of the year was to Edinburgh for Elen’s birthday. It’s a city we’ve both been to before, though not together and I’ve only ever been for work. We managed to rent an apartment in the centre which meant that we could explore on foot, or more importantly we could stumble home on foot.
Surprisingly I took very few photos, probably because we were too busy stuffing our faces with delicious food and coffee. It’s such a lovely city and one I’m sure I’ll visit again soon – highly recommended.
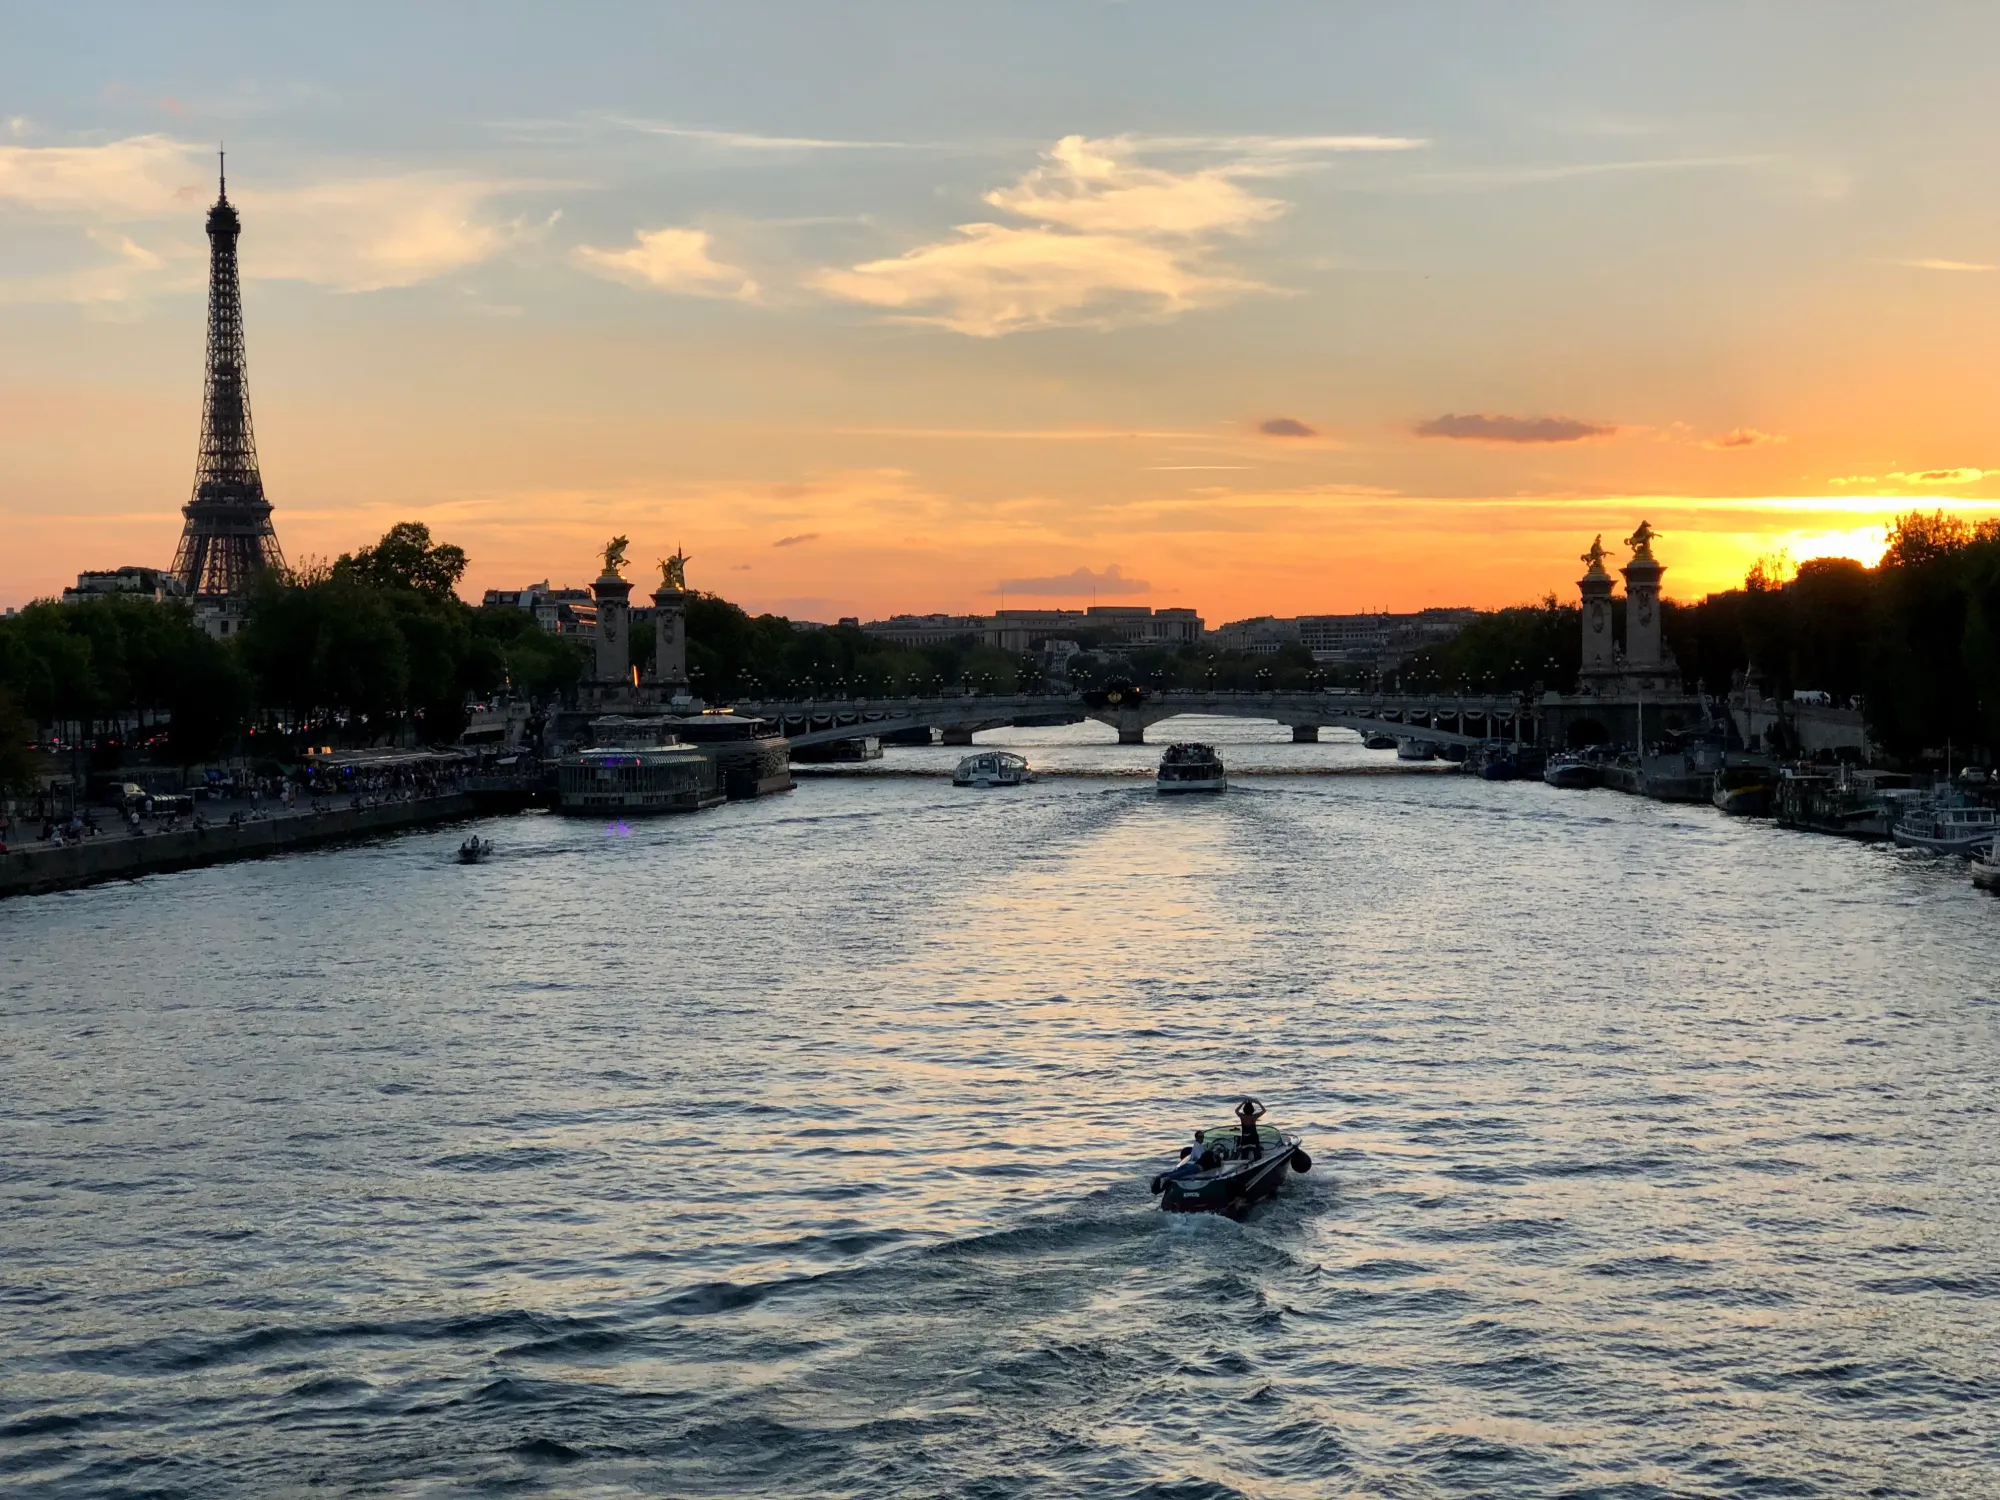
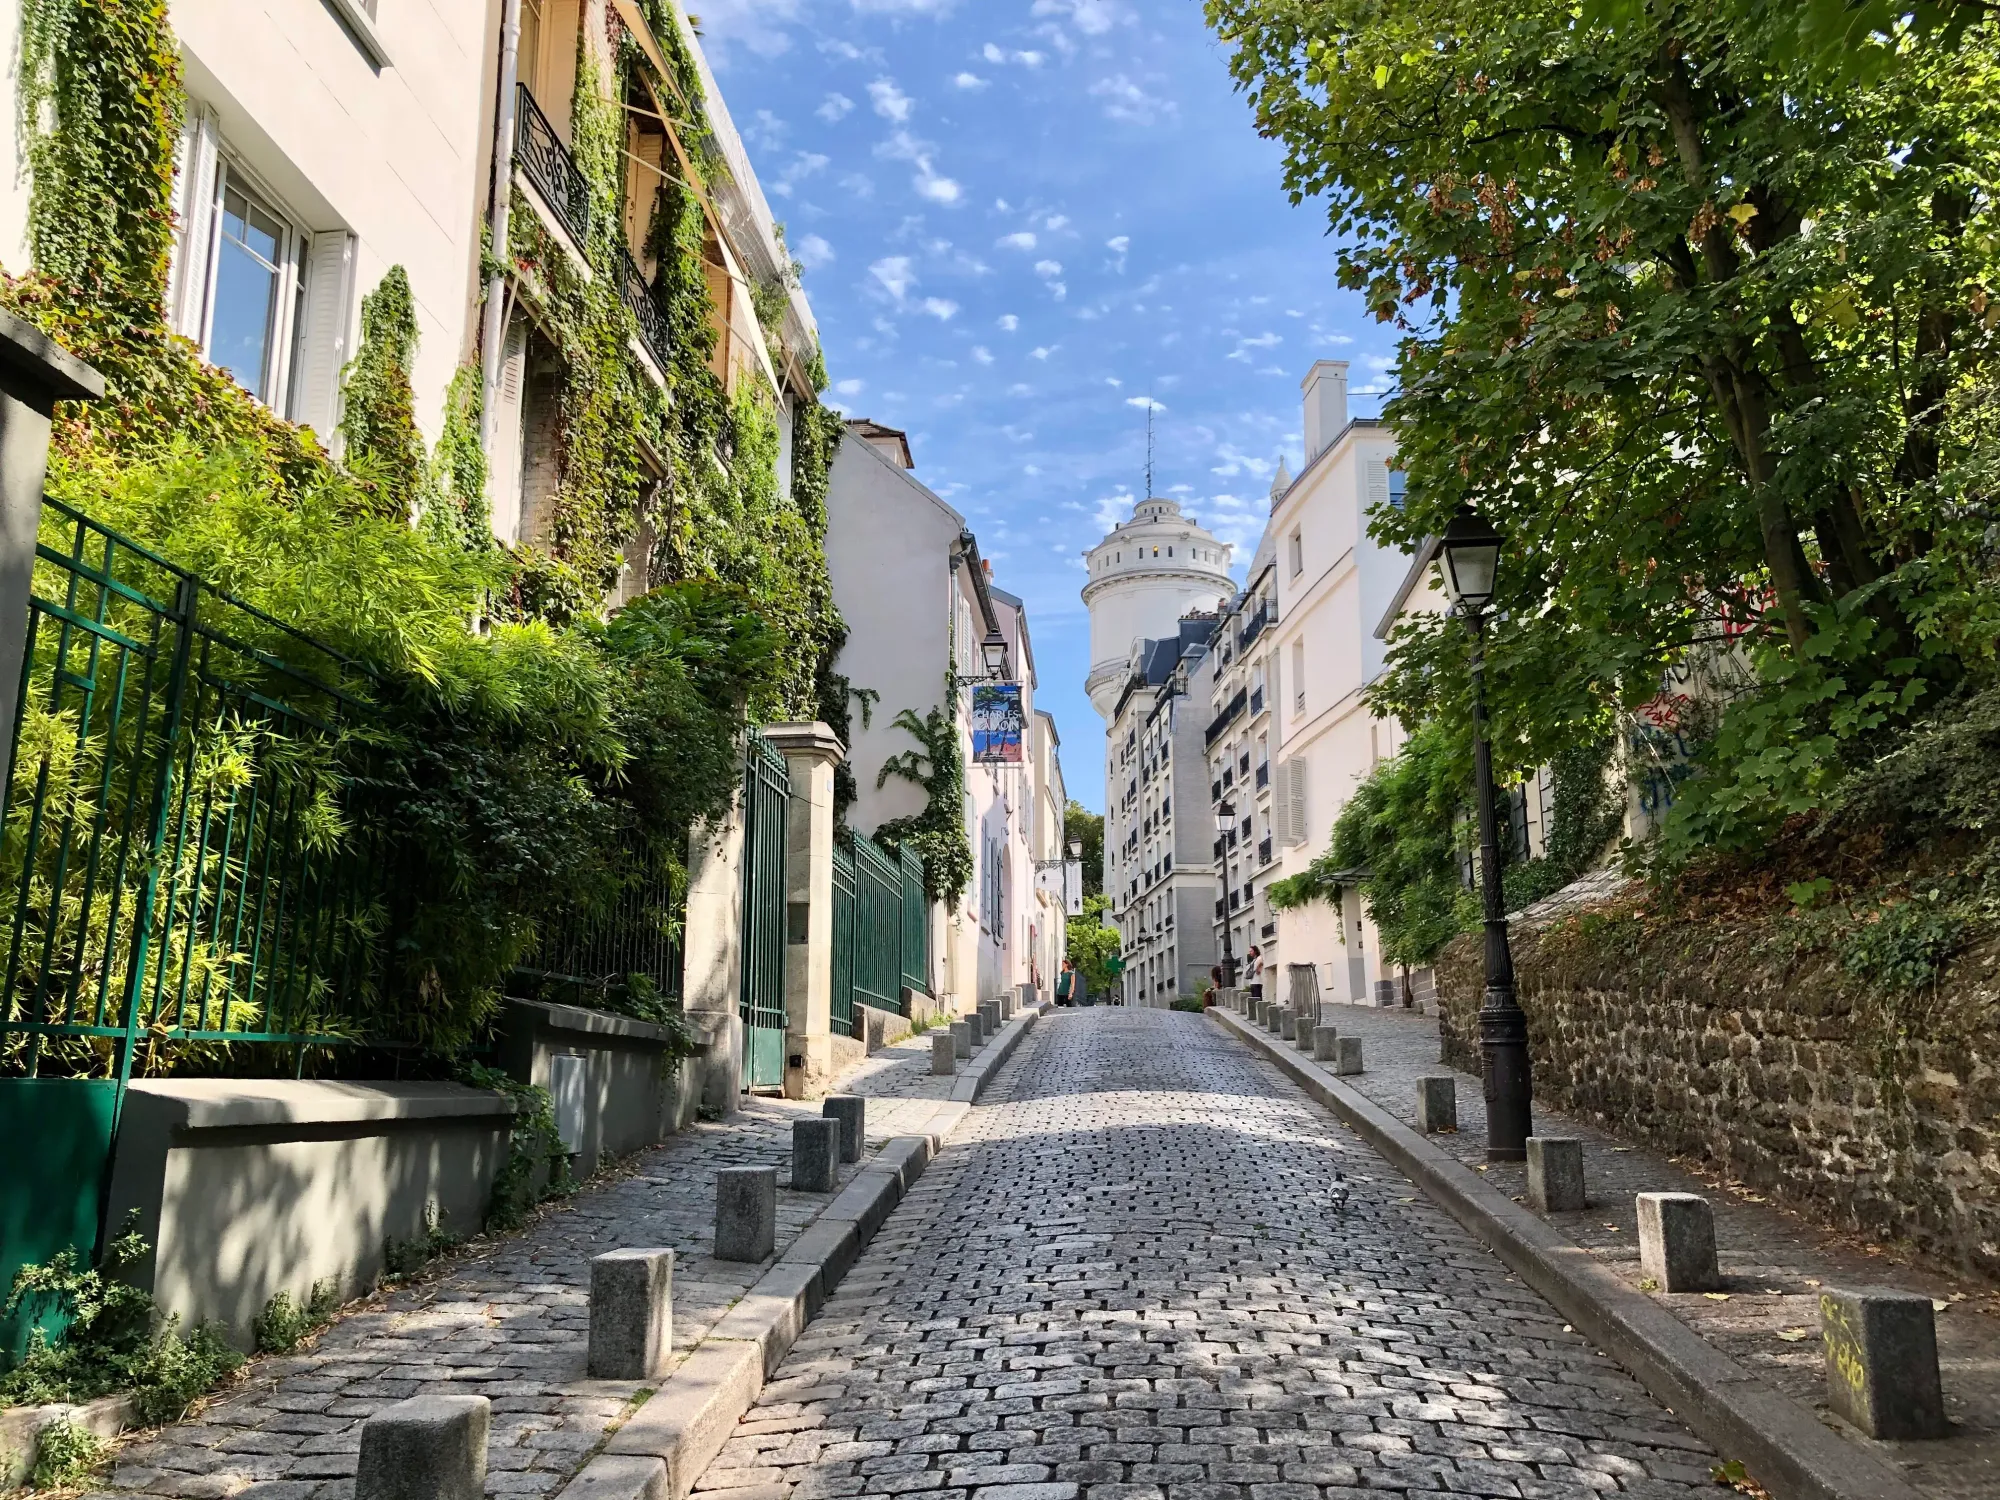
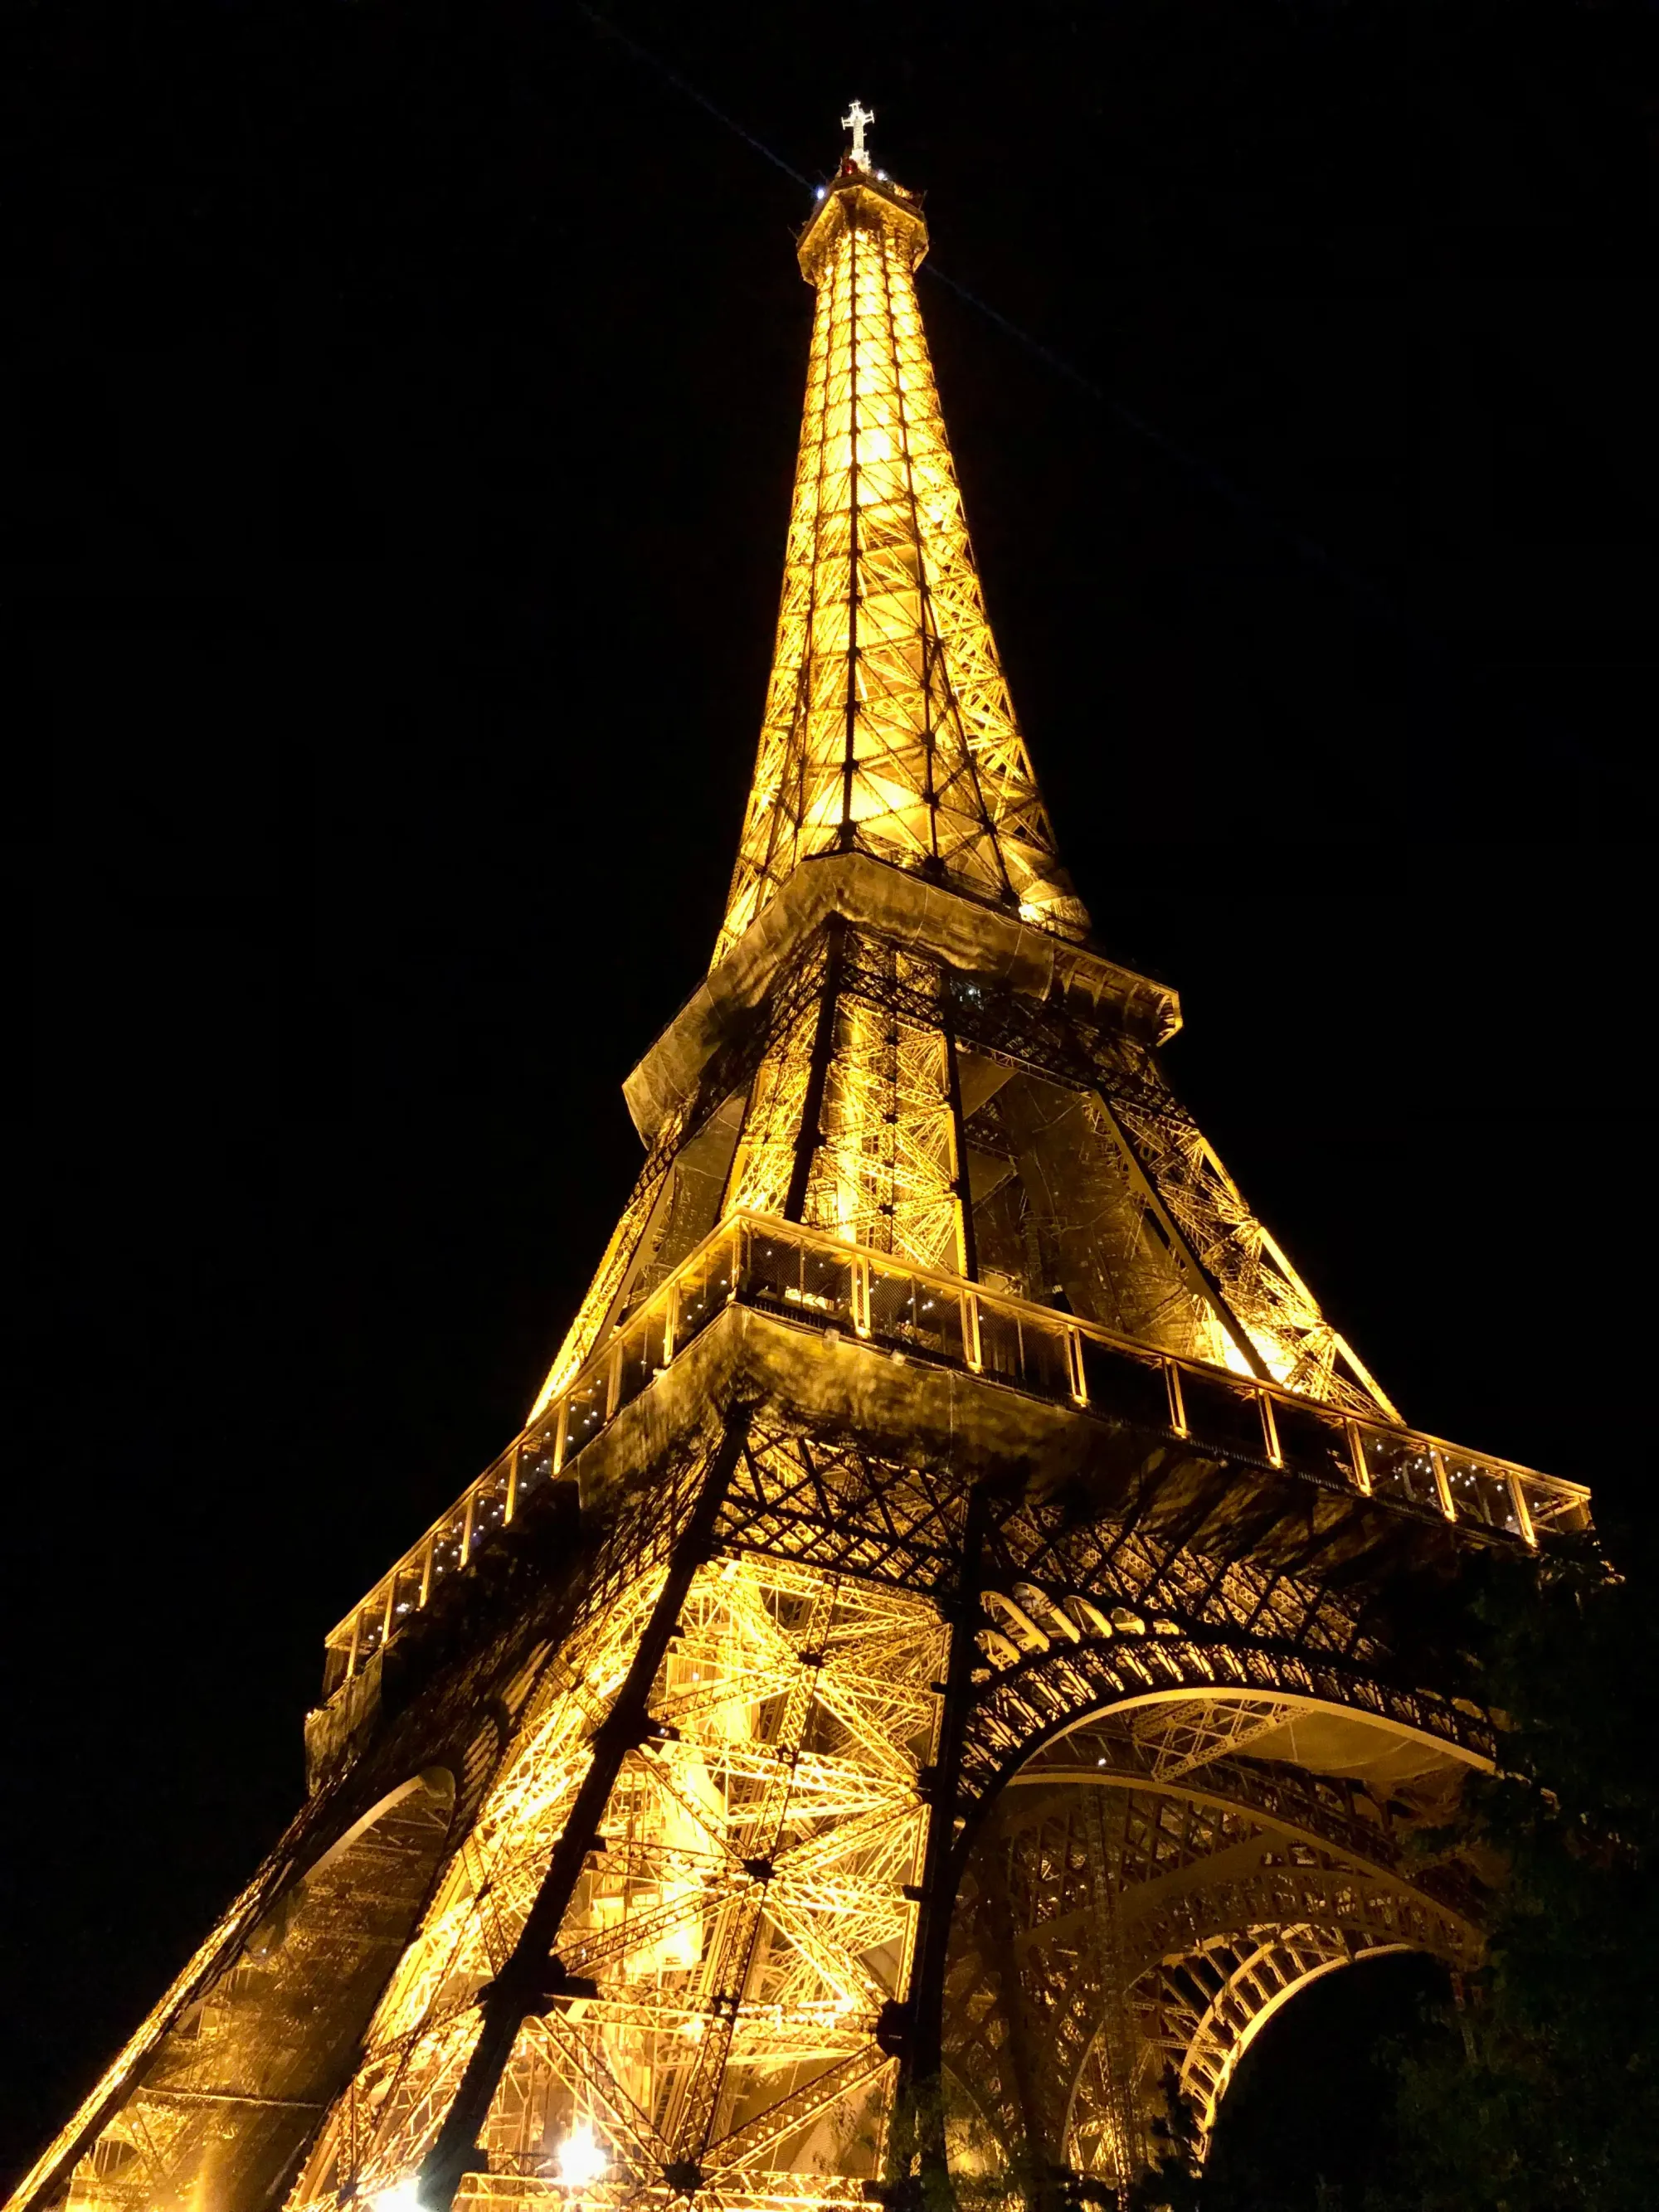
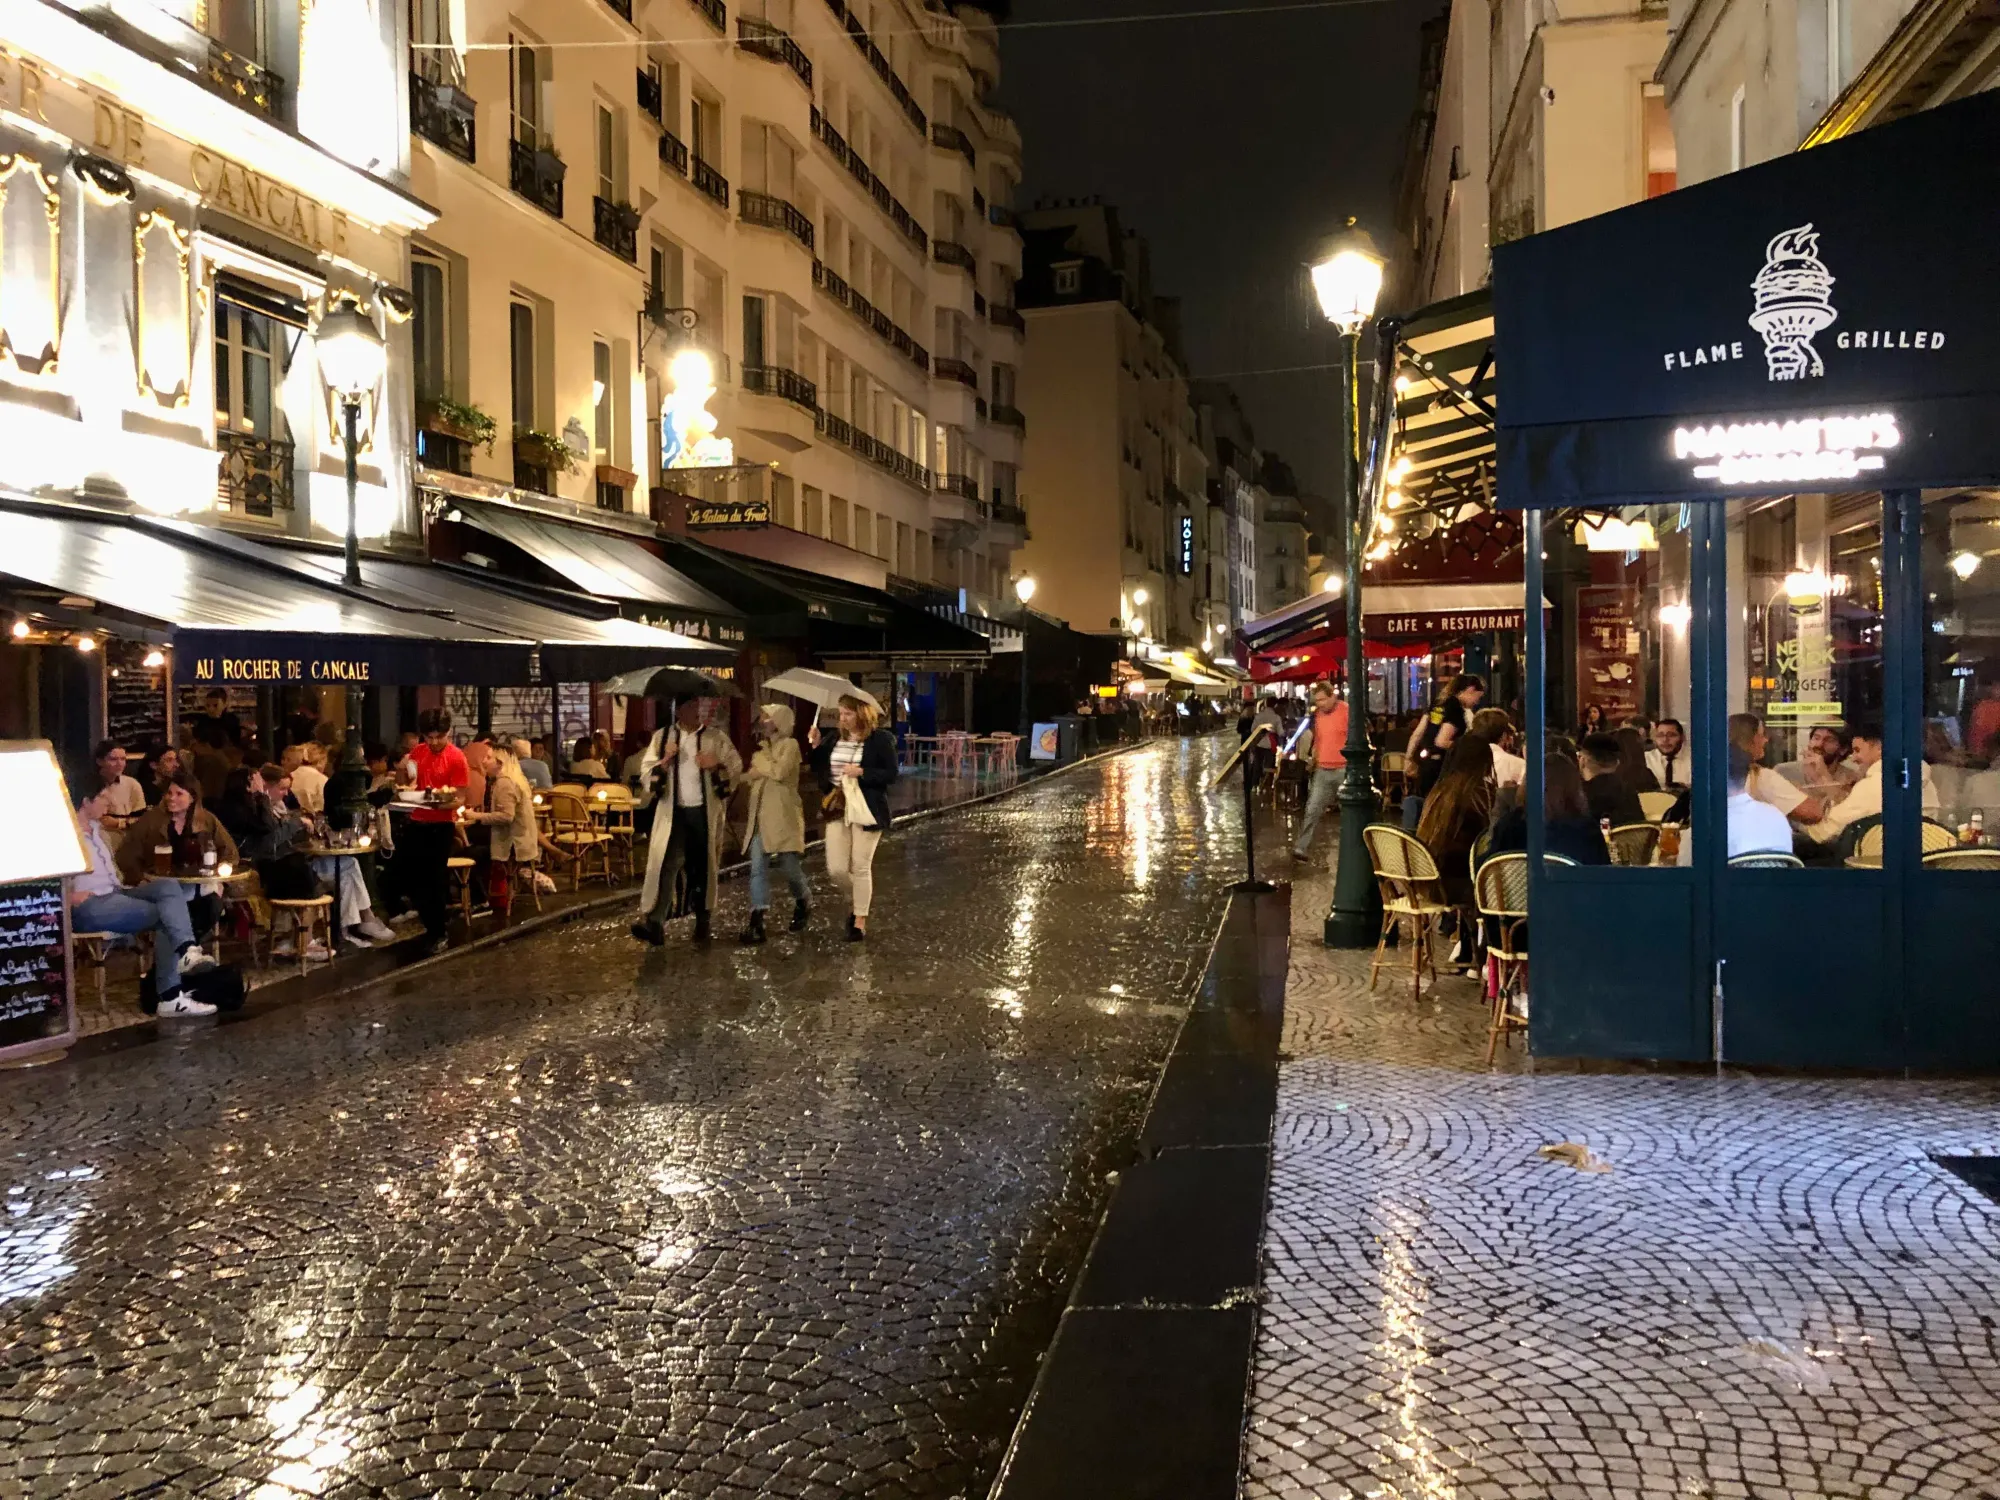
Paris, France
For my birthday we went to Paris for a few days, a city that I’d somehow not visited before even though I’ve visited France plenty of times. We took the Eurostar in an effort to avoid unnecessary air travel, which was a bit of a faff (mostly getting from North Wales to London) but something I’d definitely do again next time.
It was glorious though, it’s such a beautiful city. And it also helps that the food is amazing, so we mostly spent our time exploring between meals. In a way it sort of reminds me of London, I’m not sure why. That’s a good thing though.
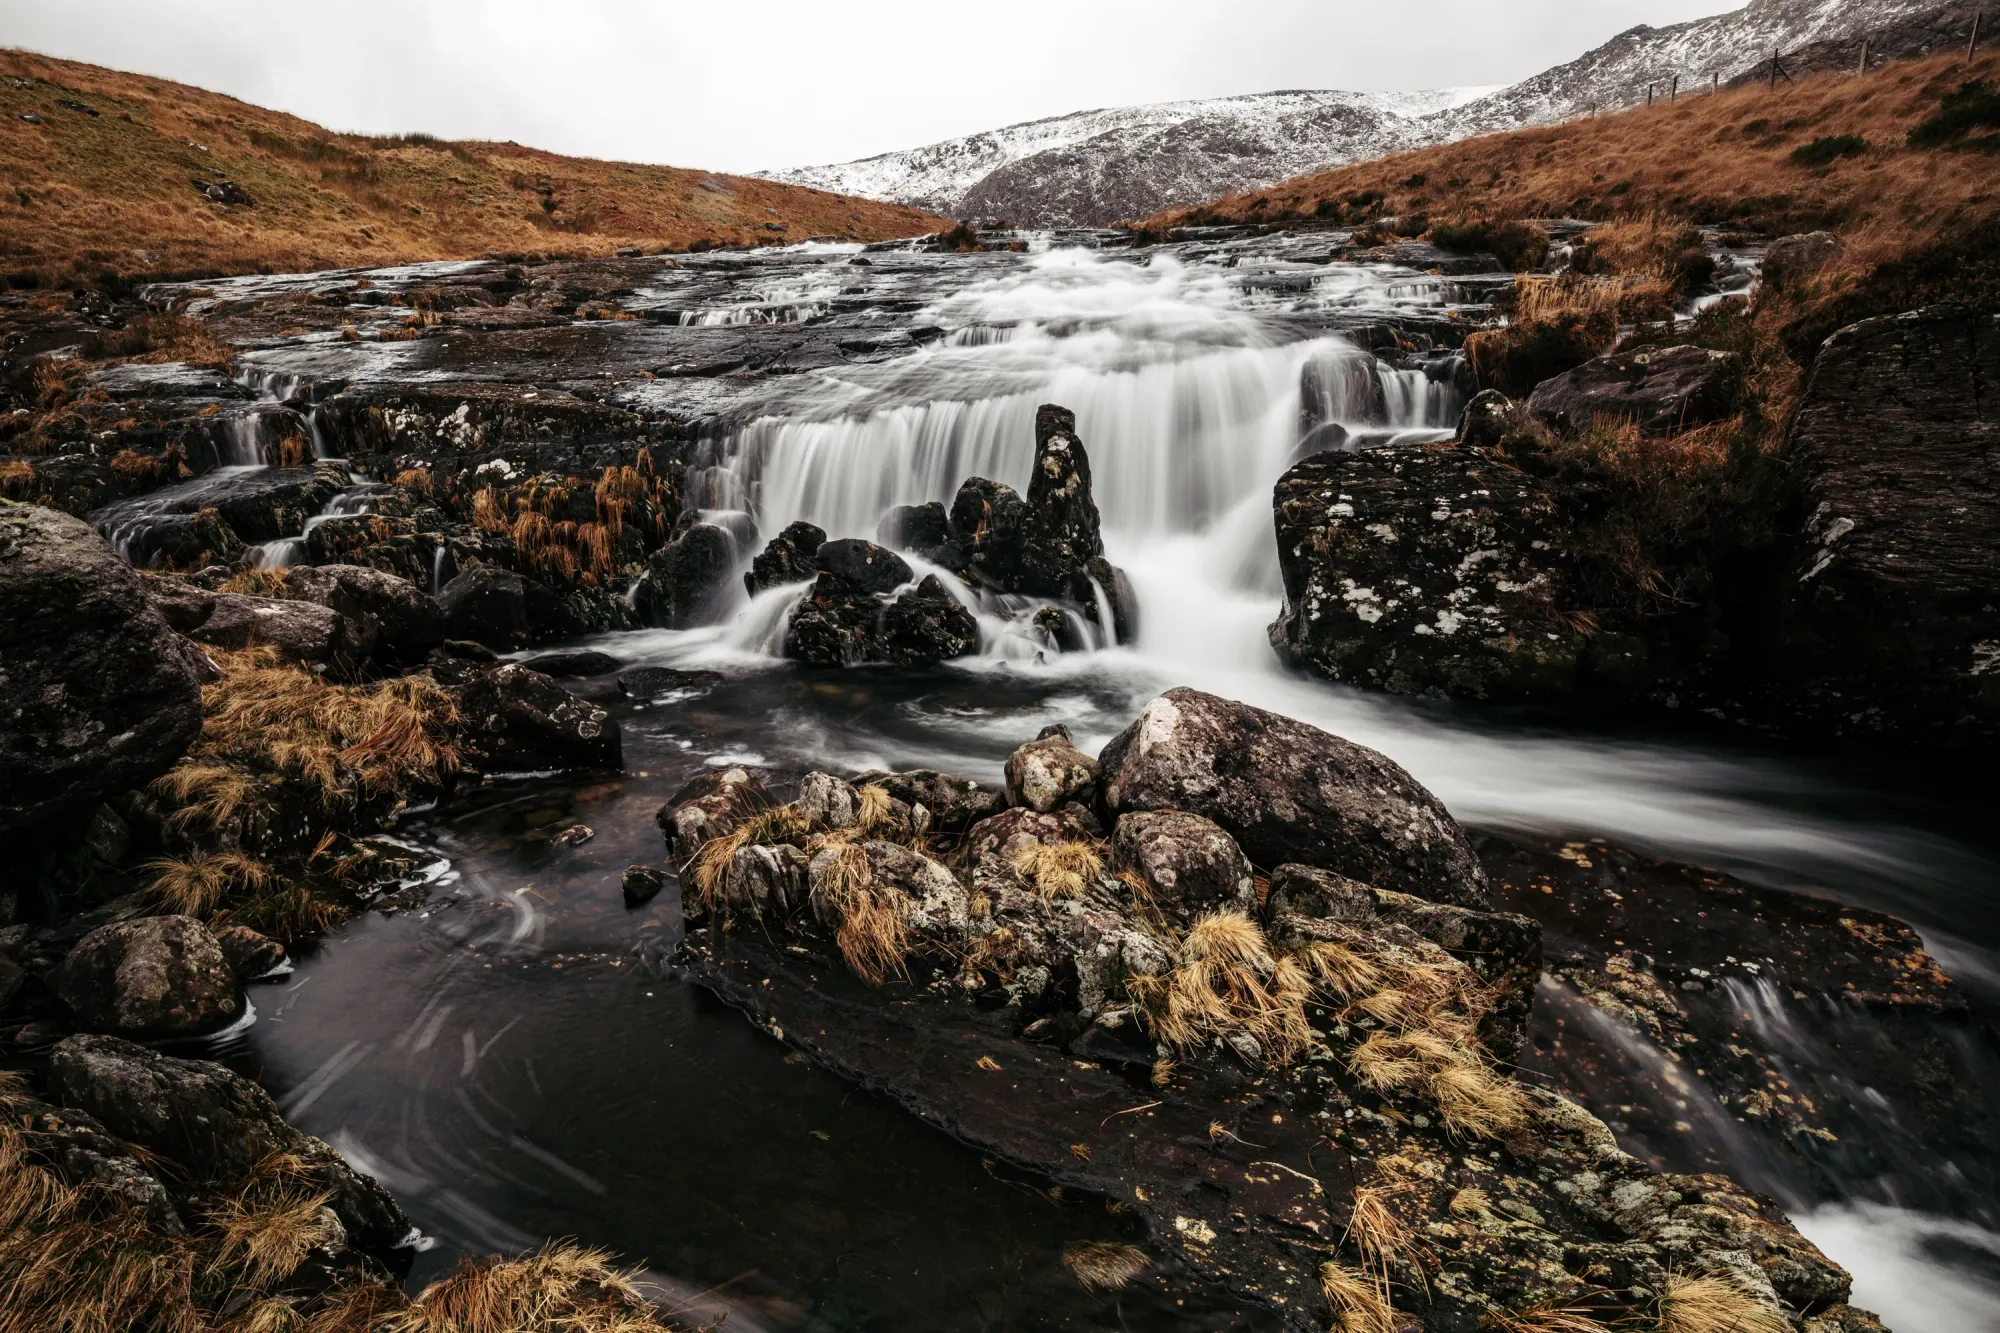
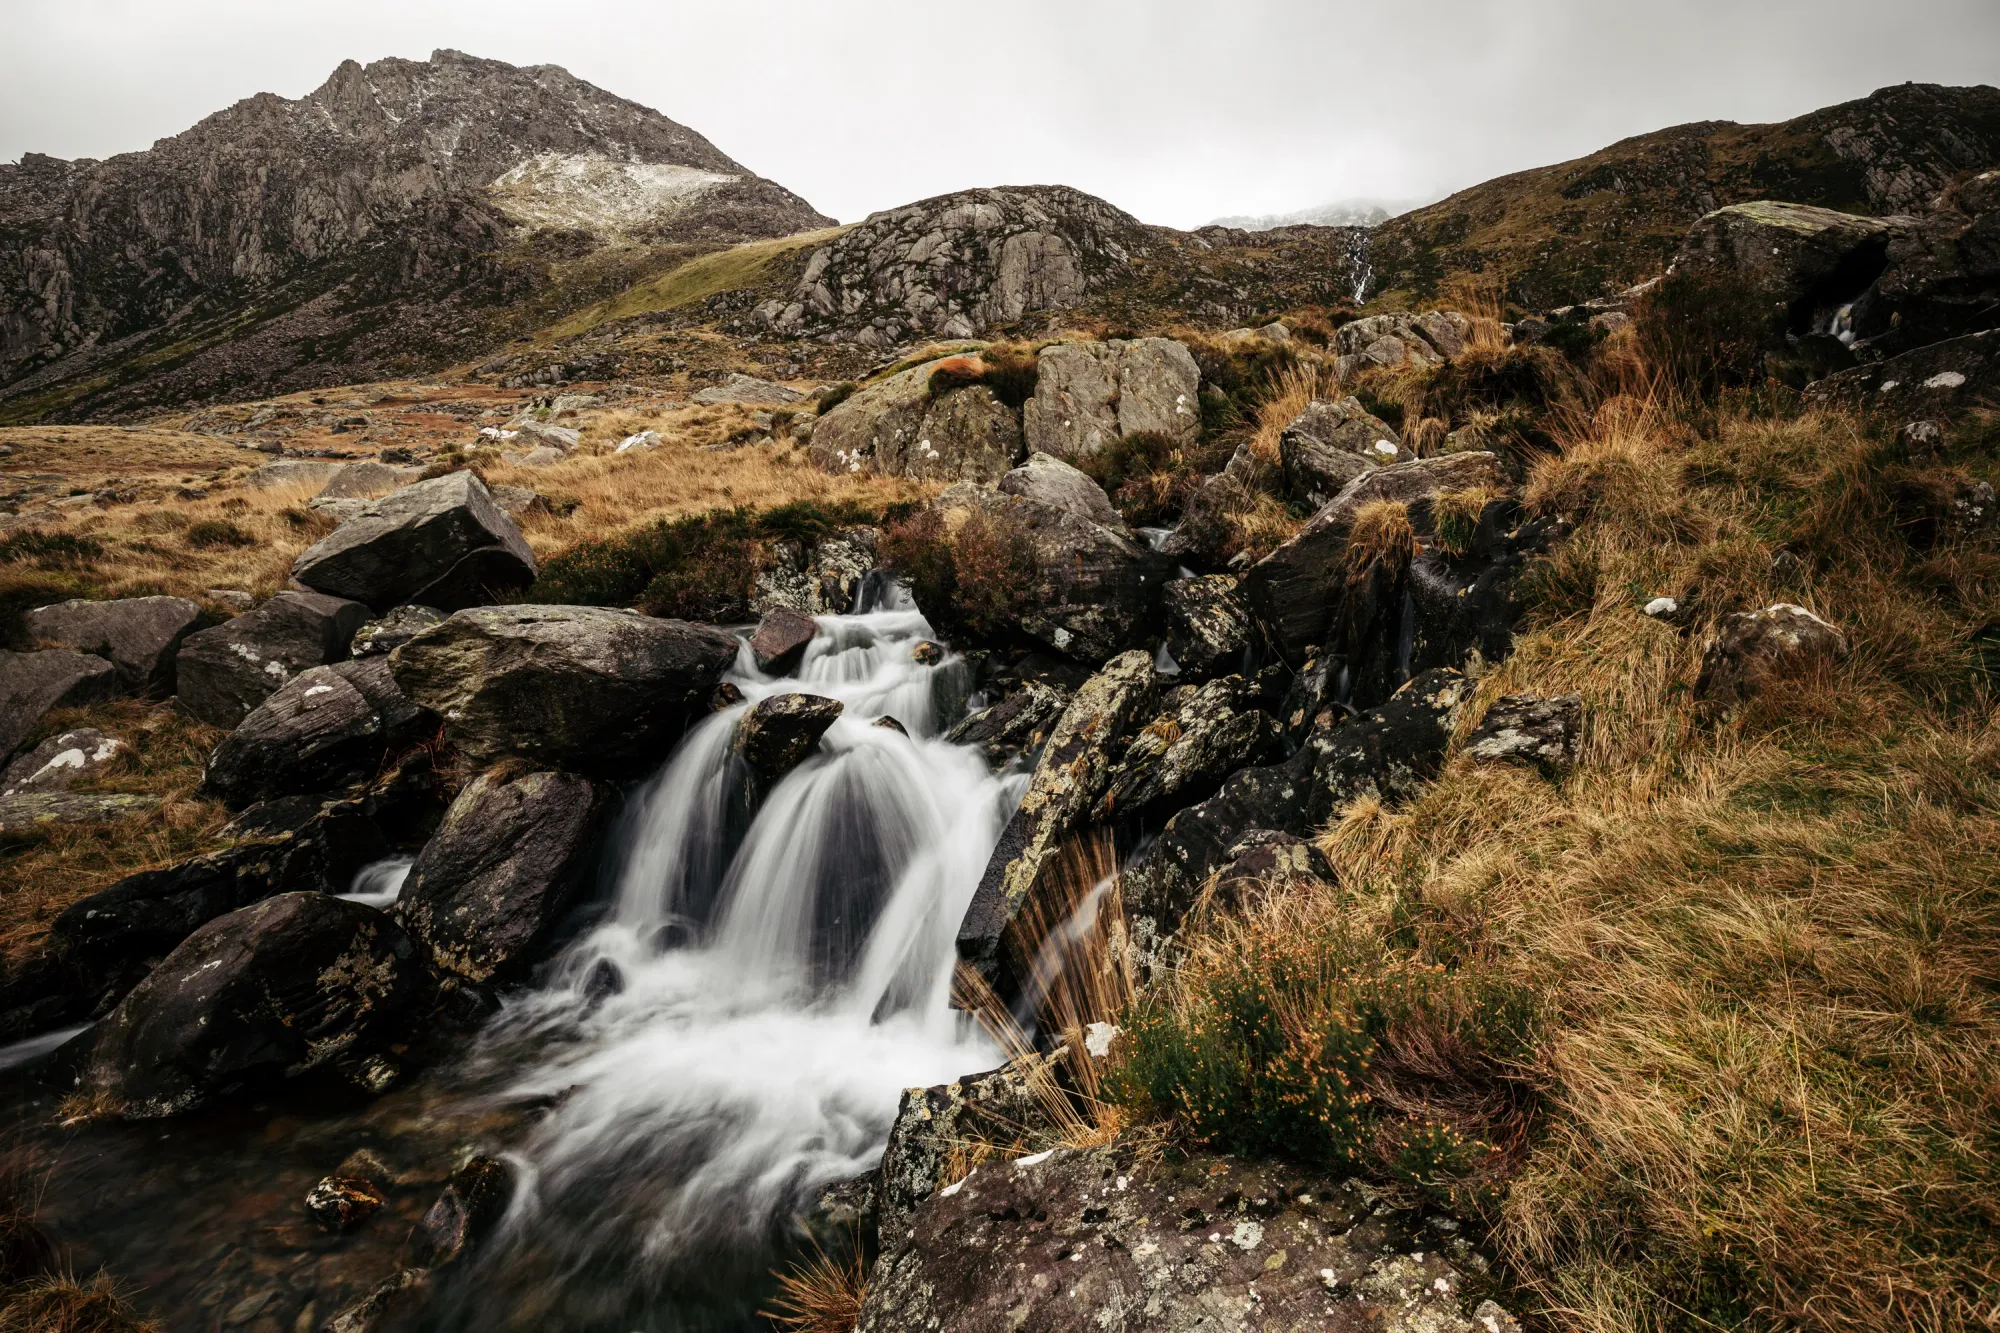
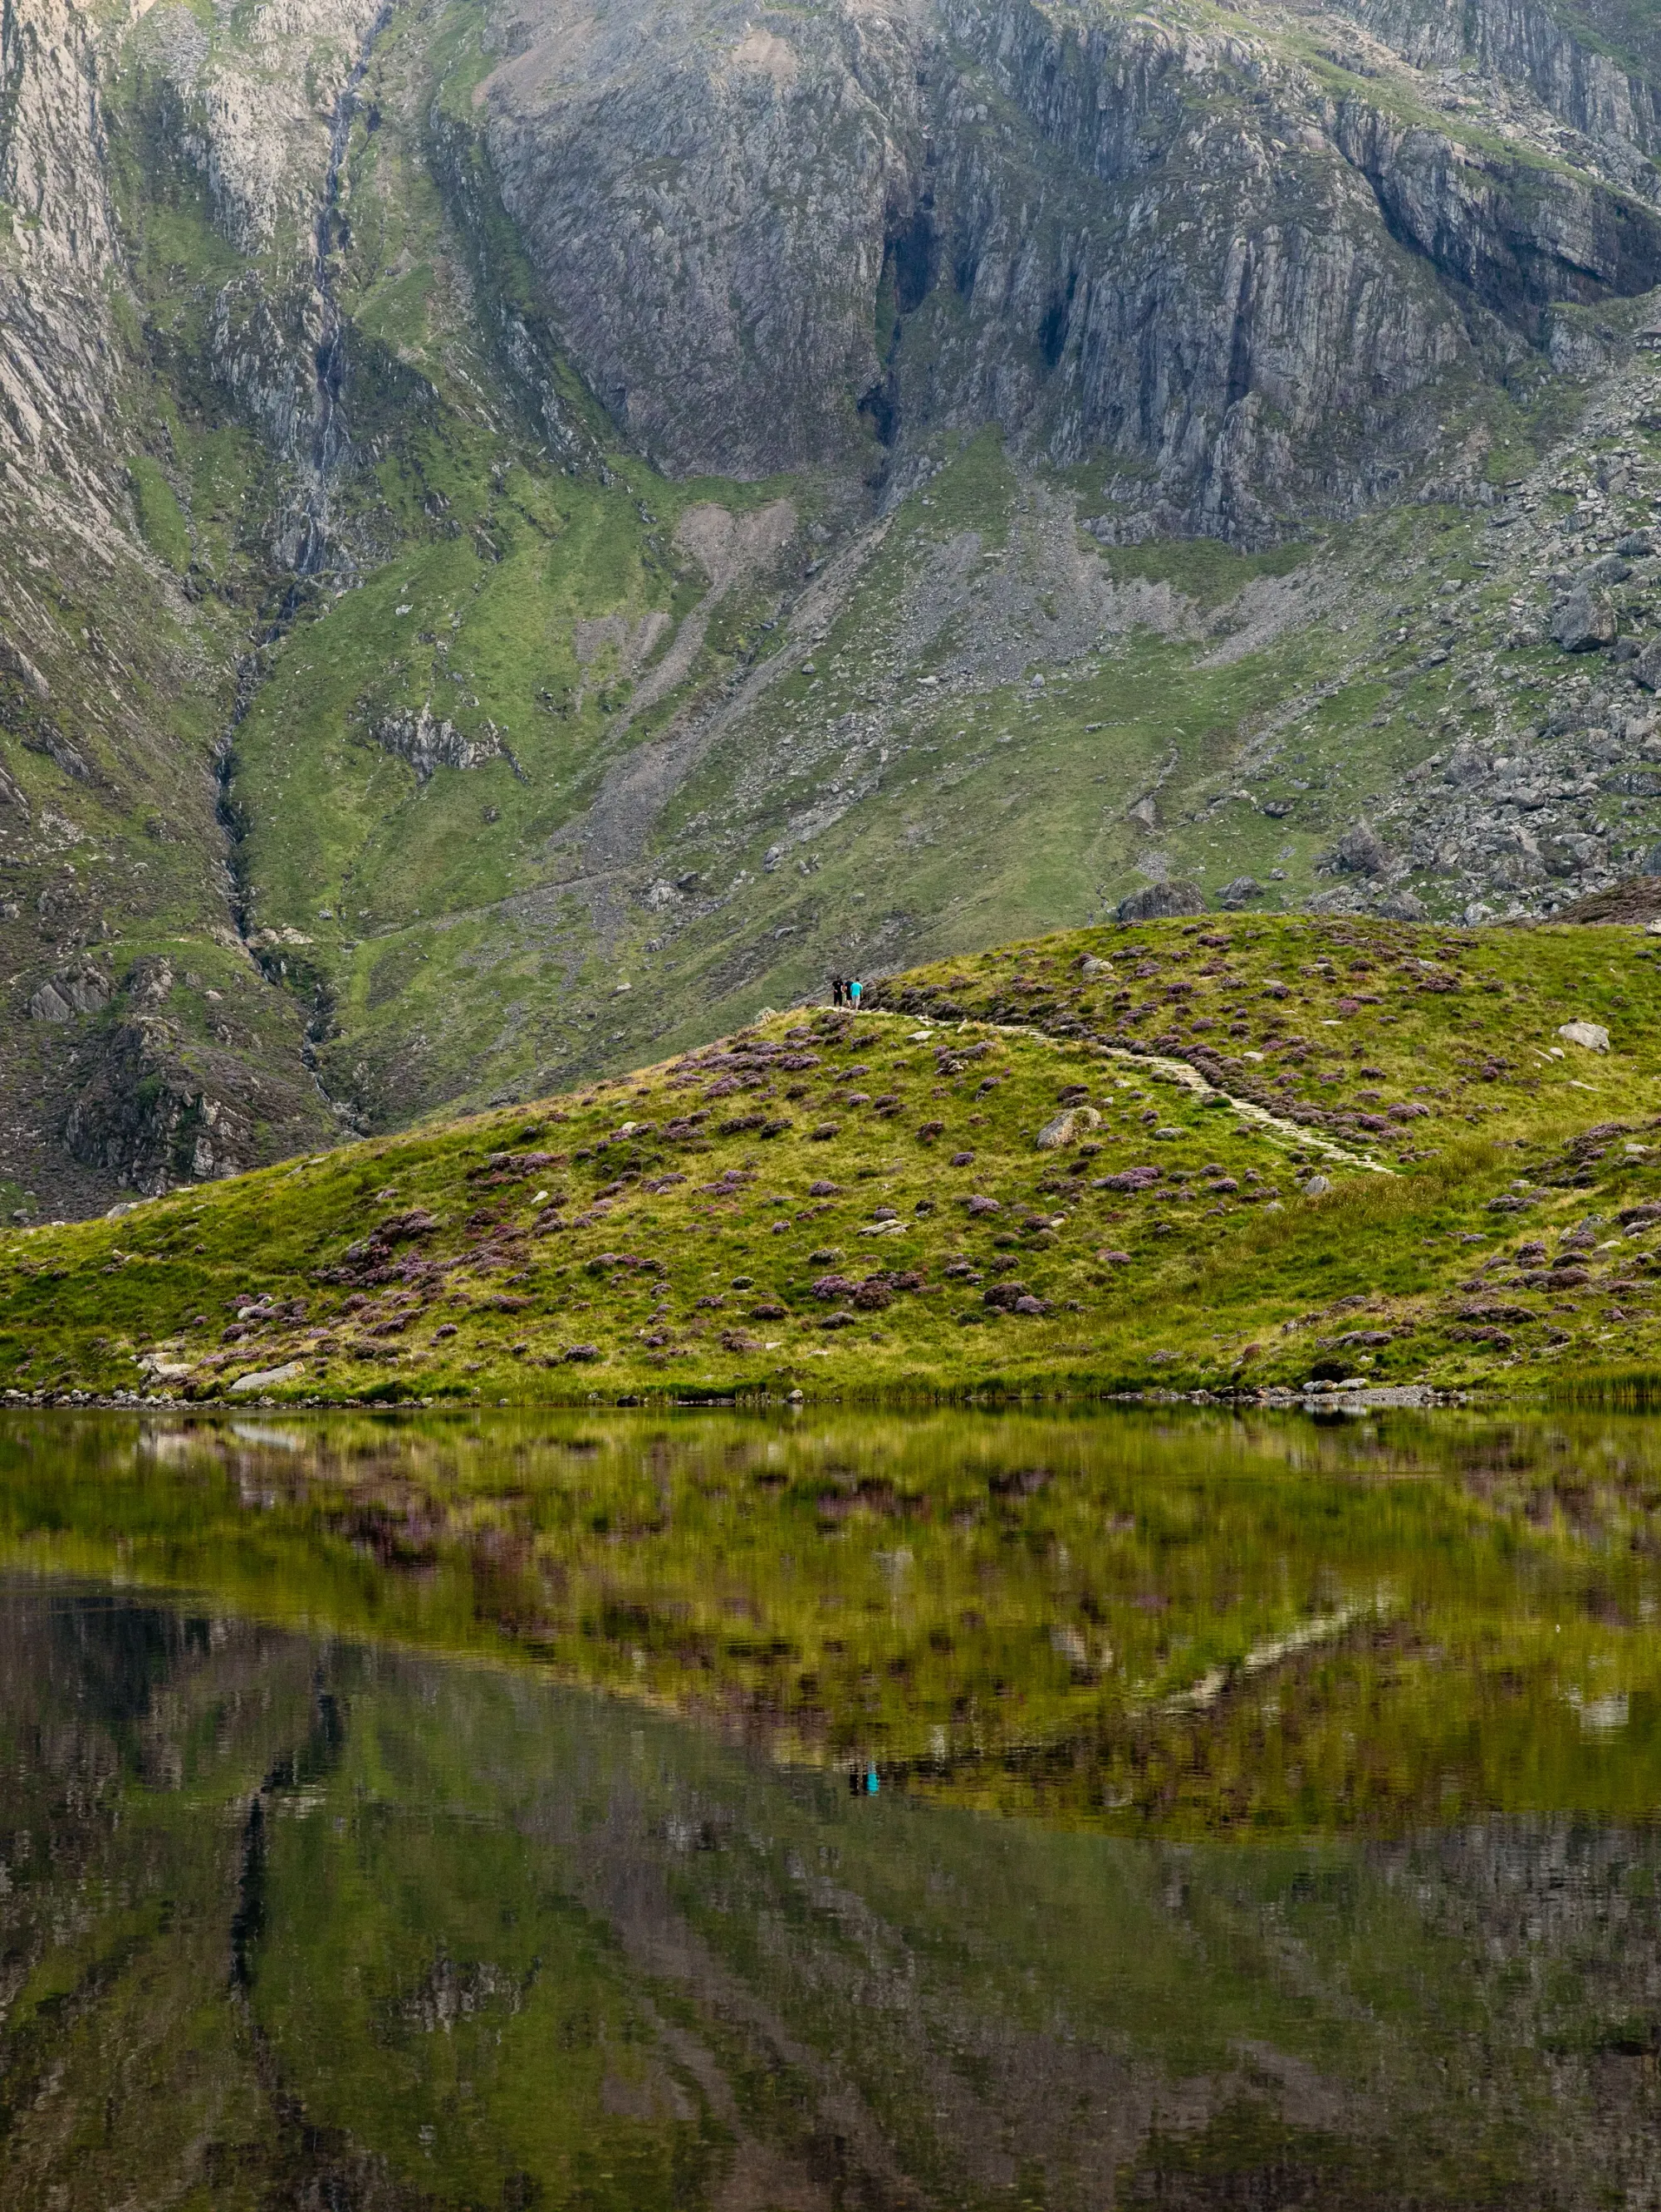
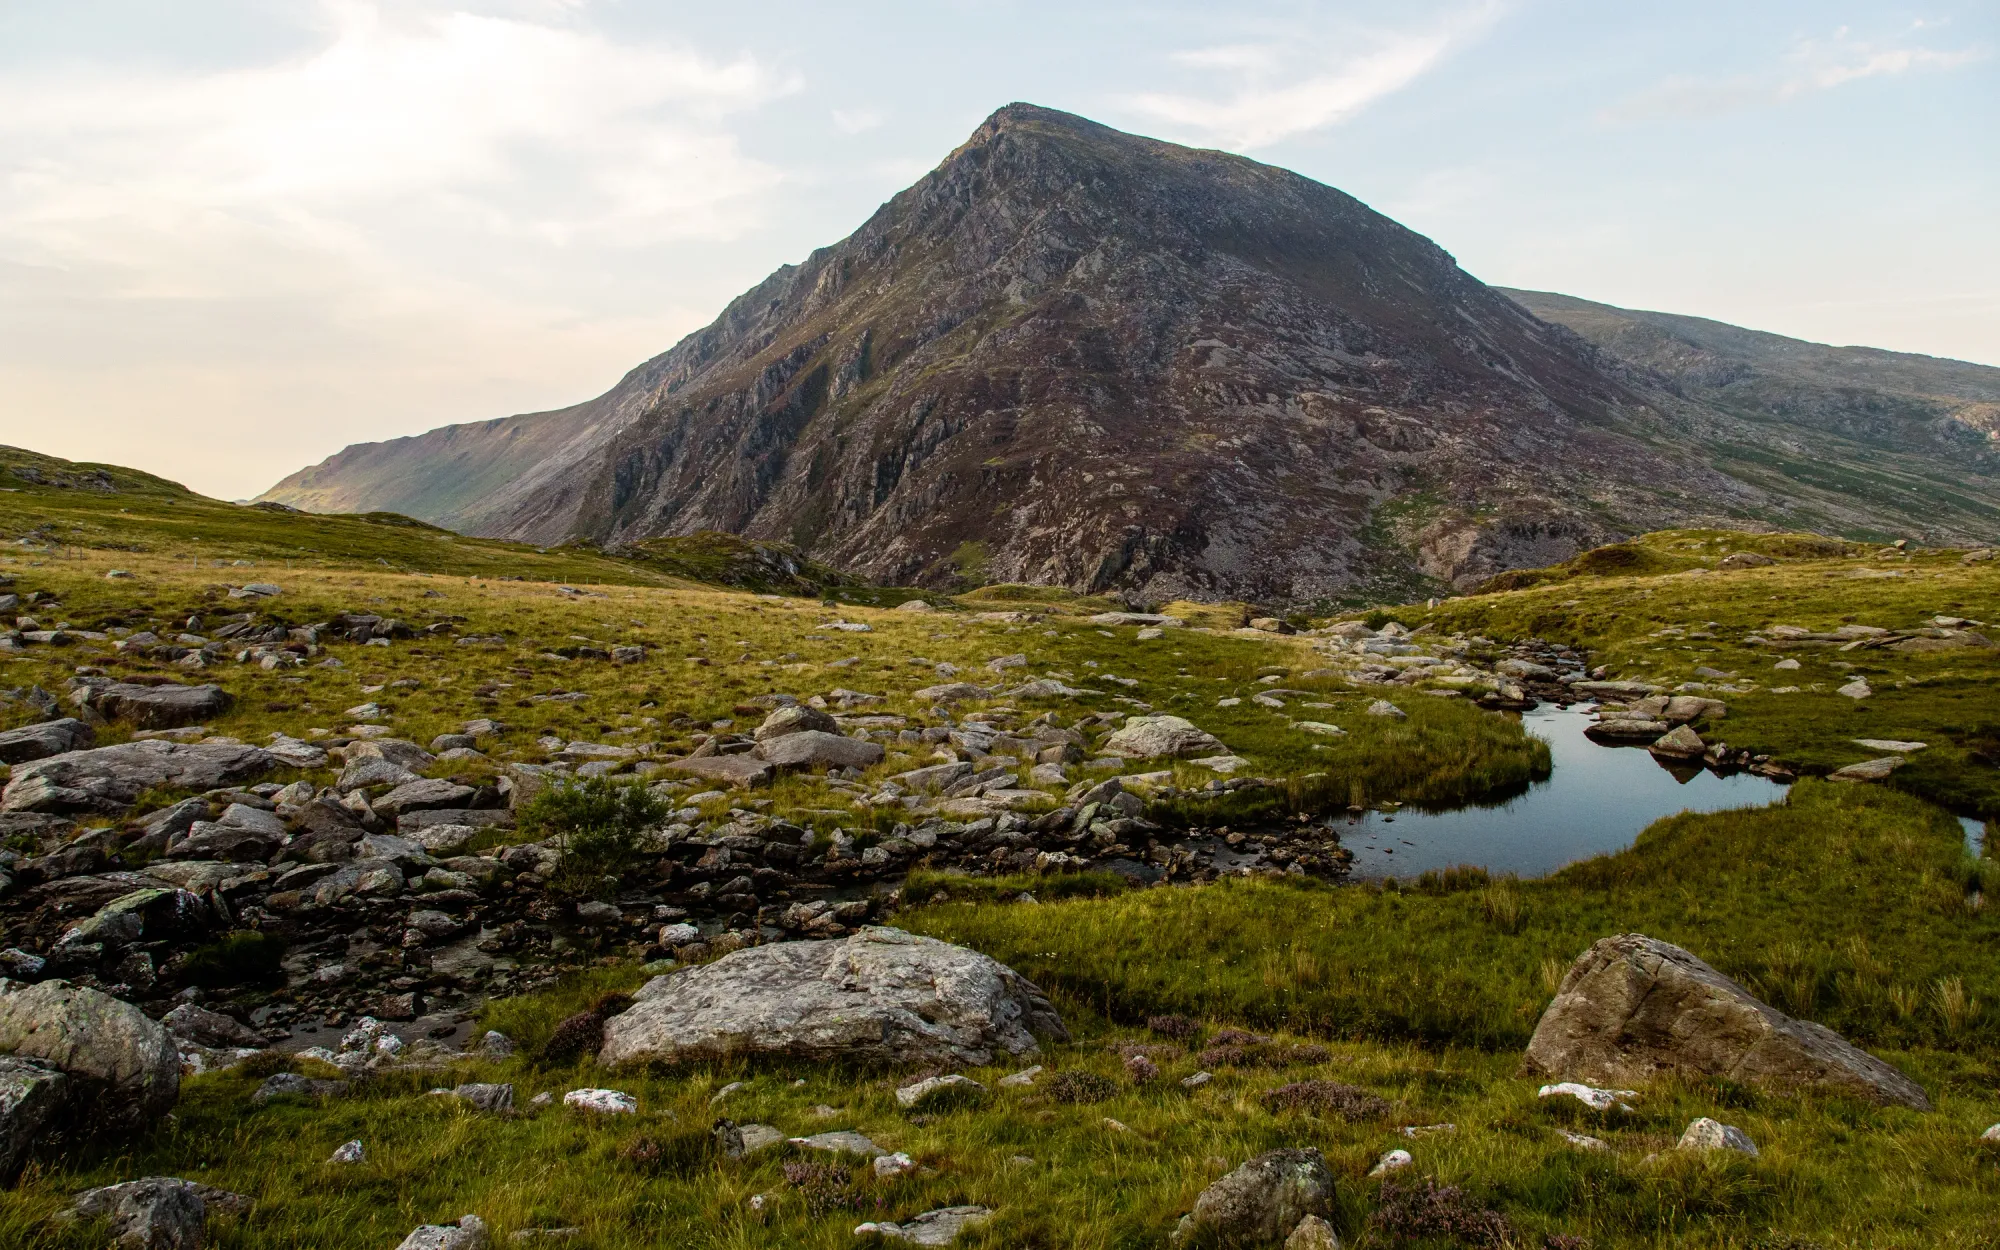
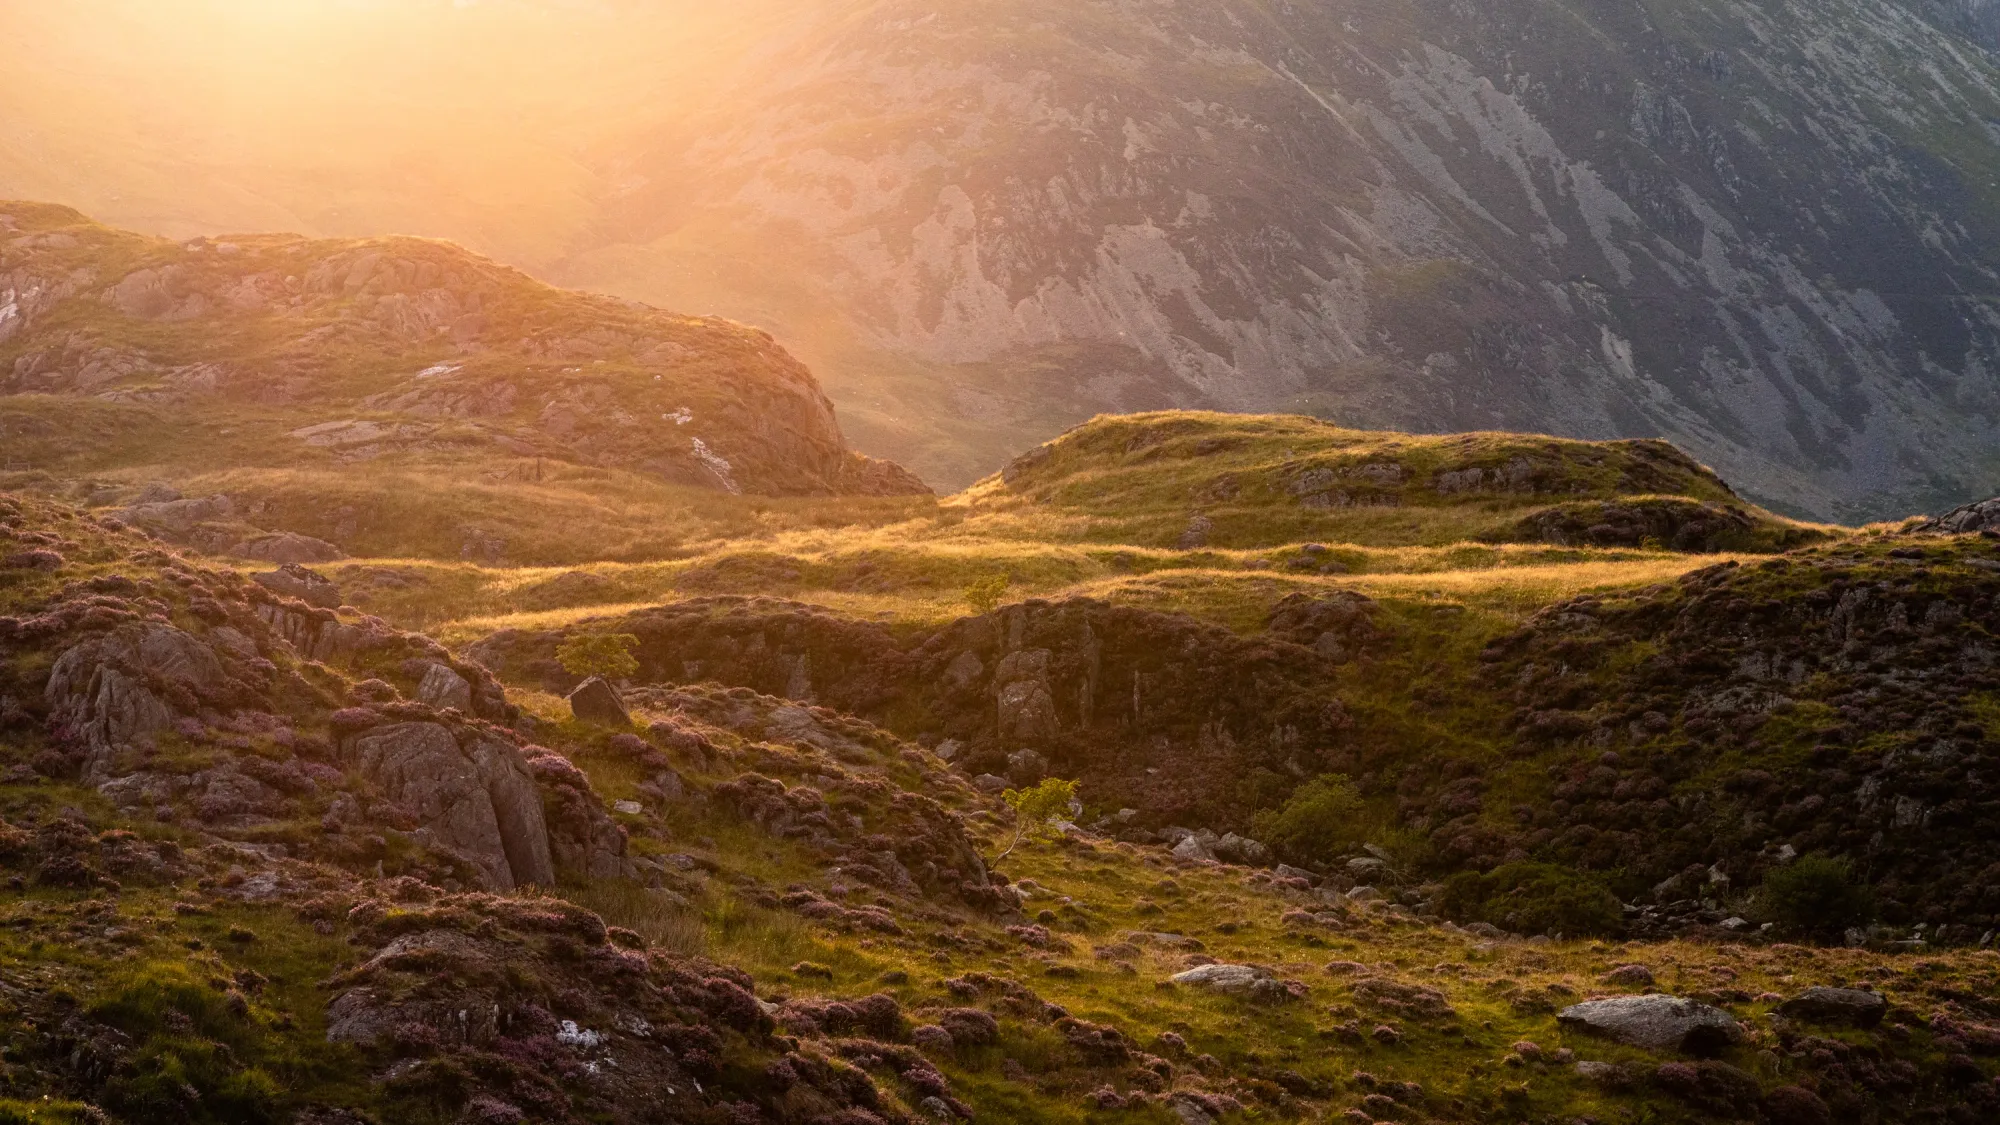
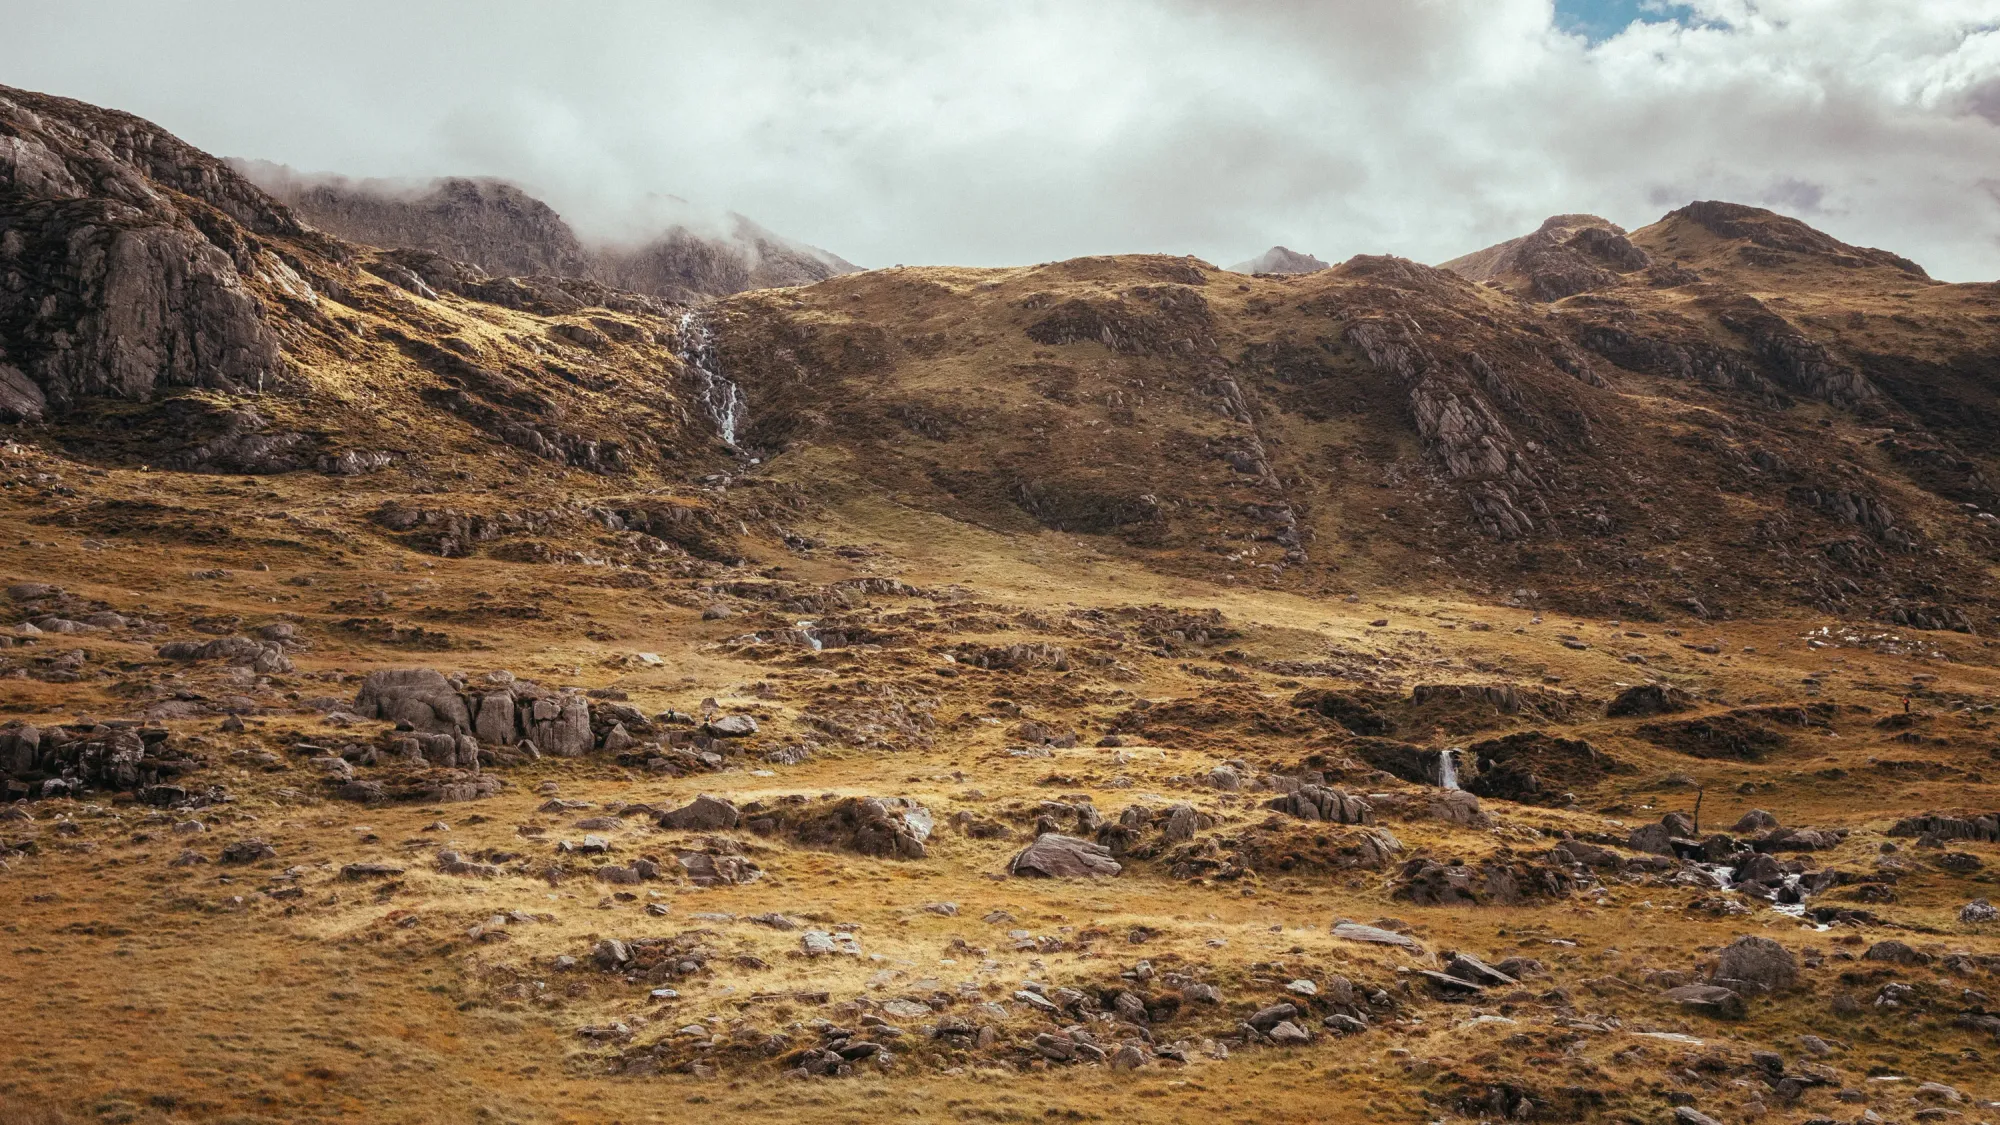
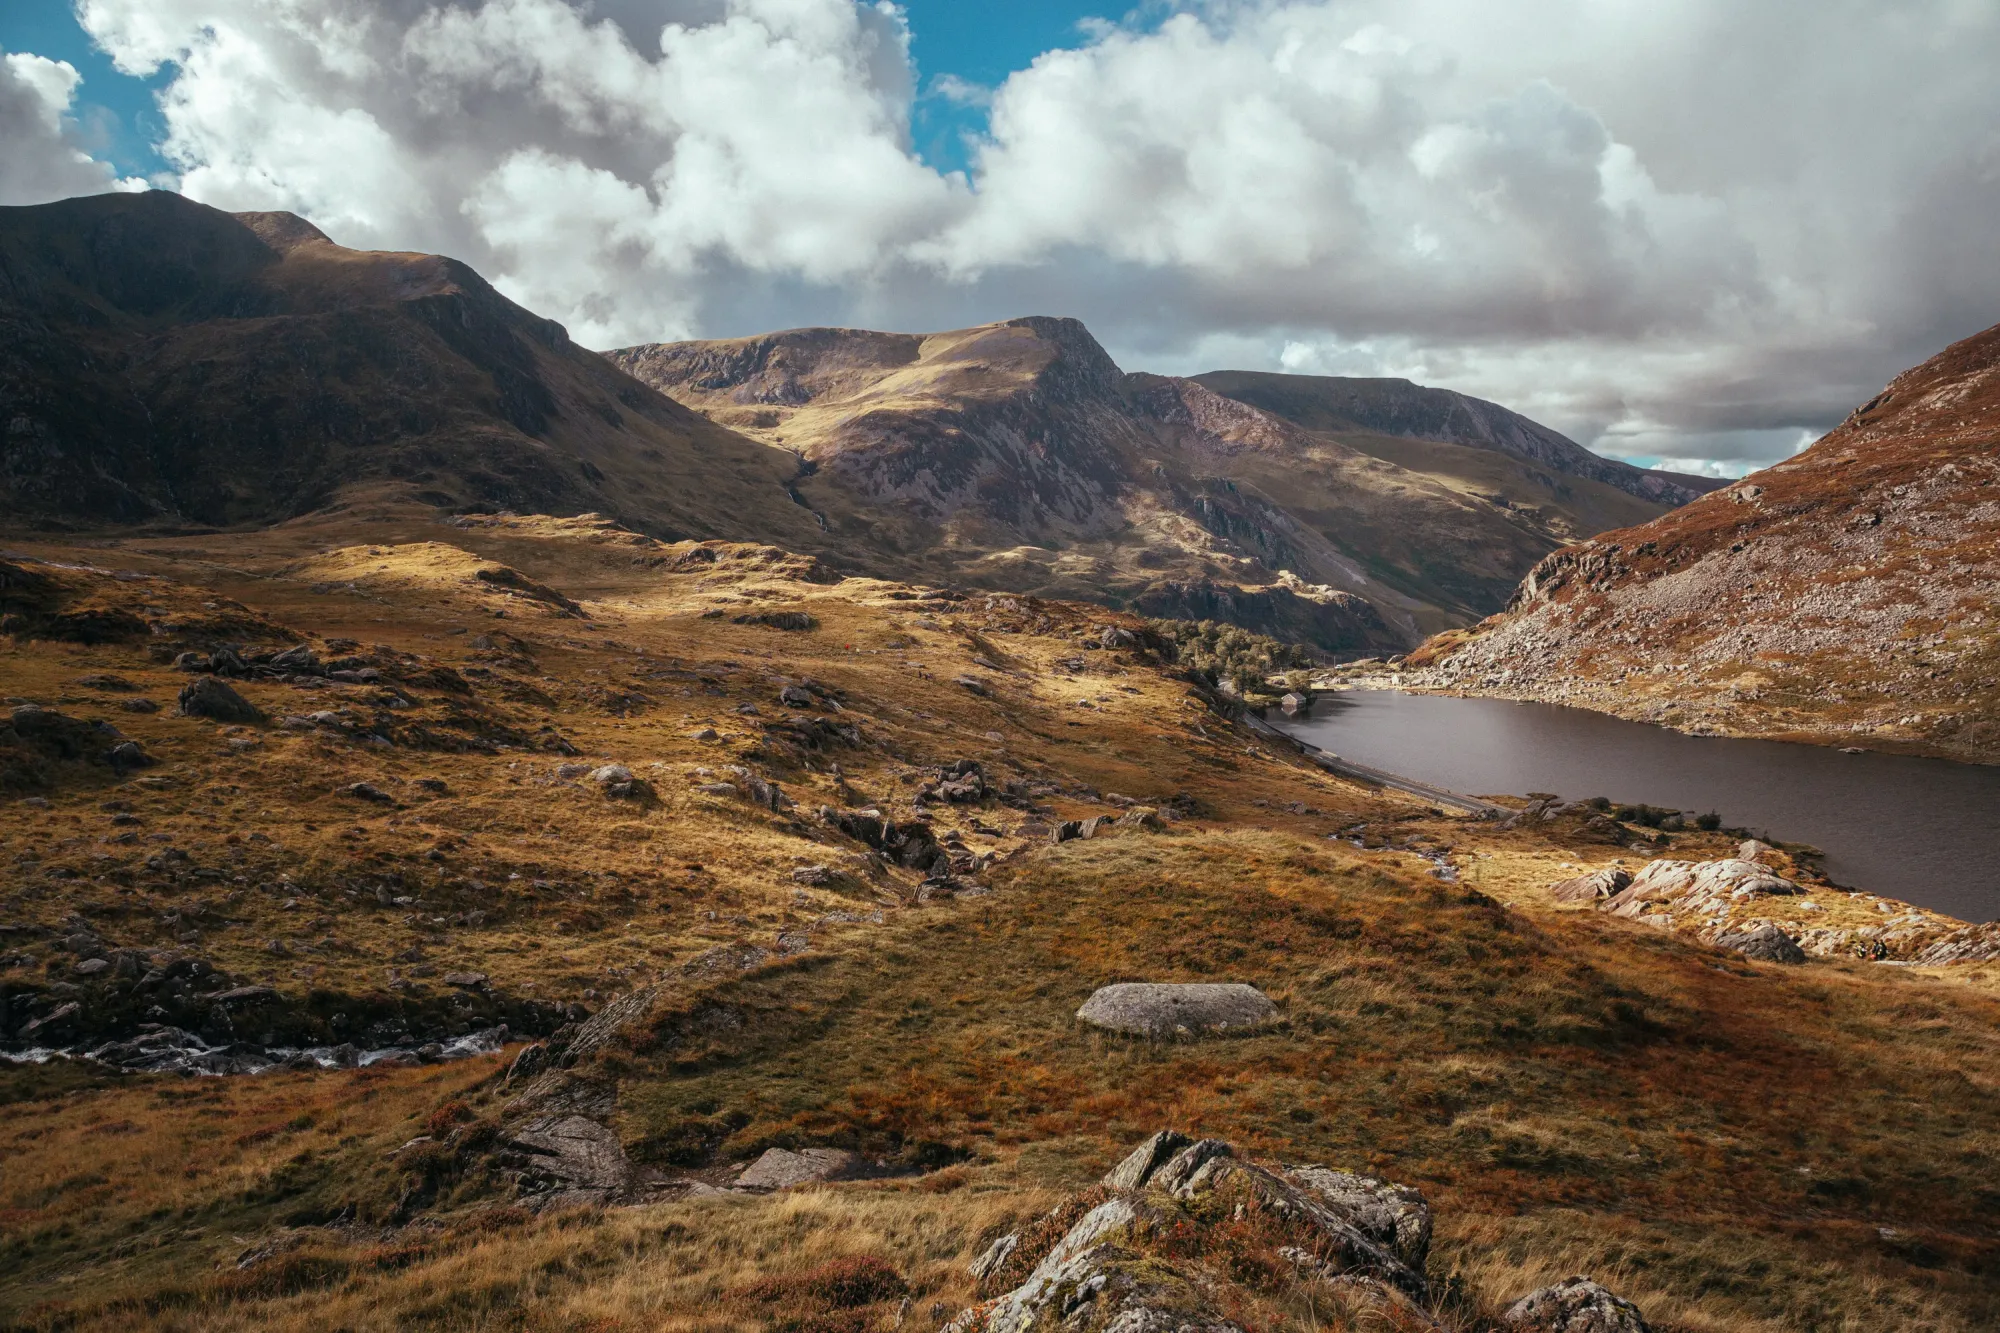
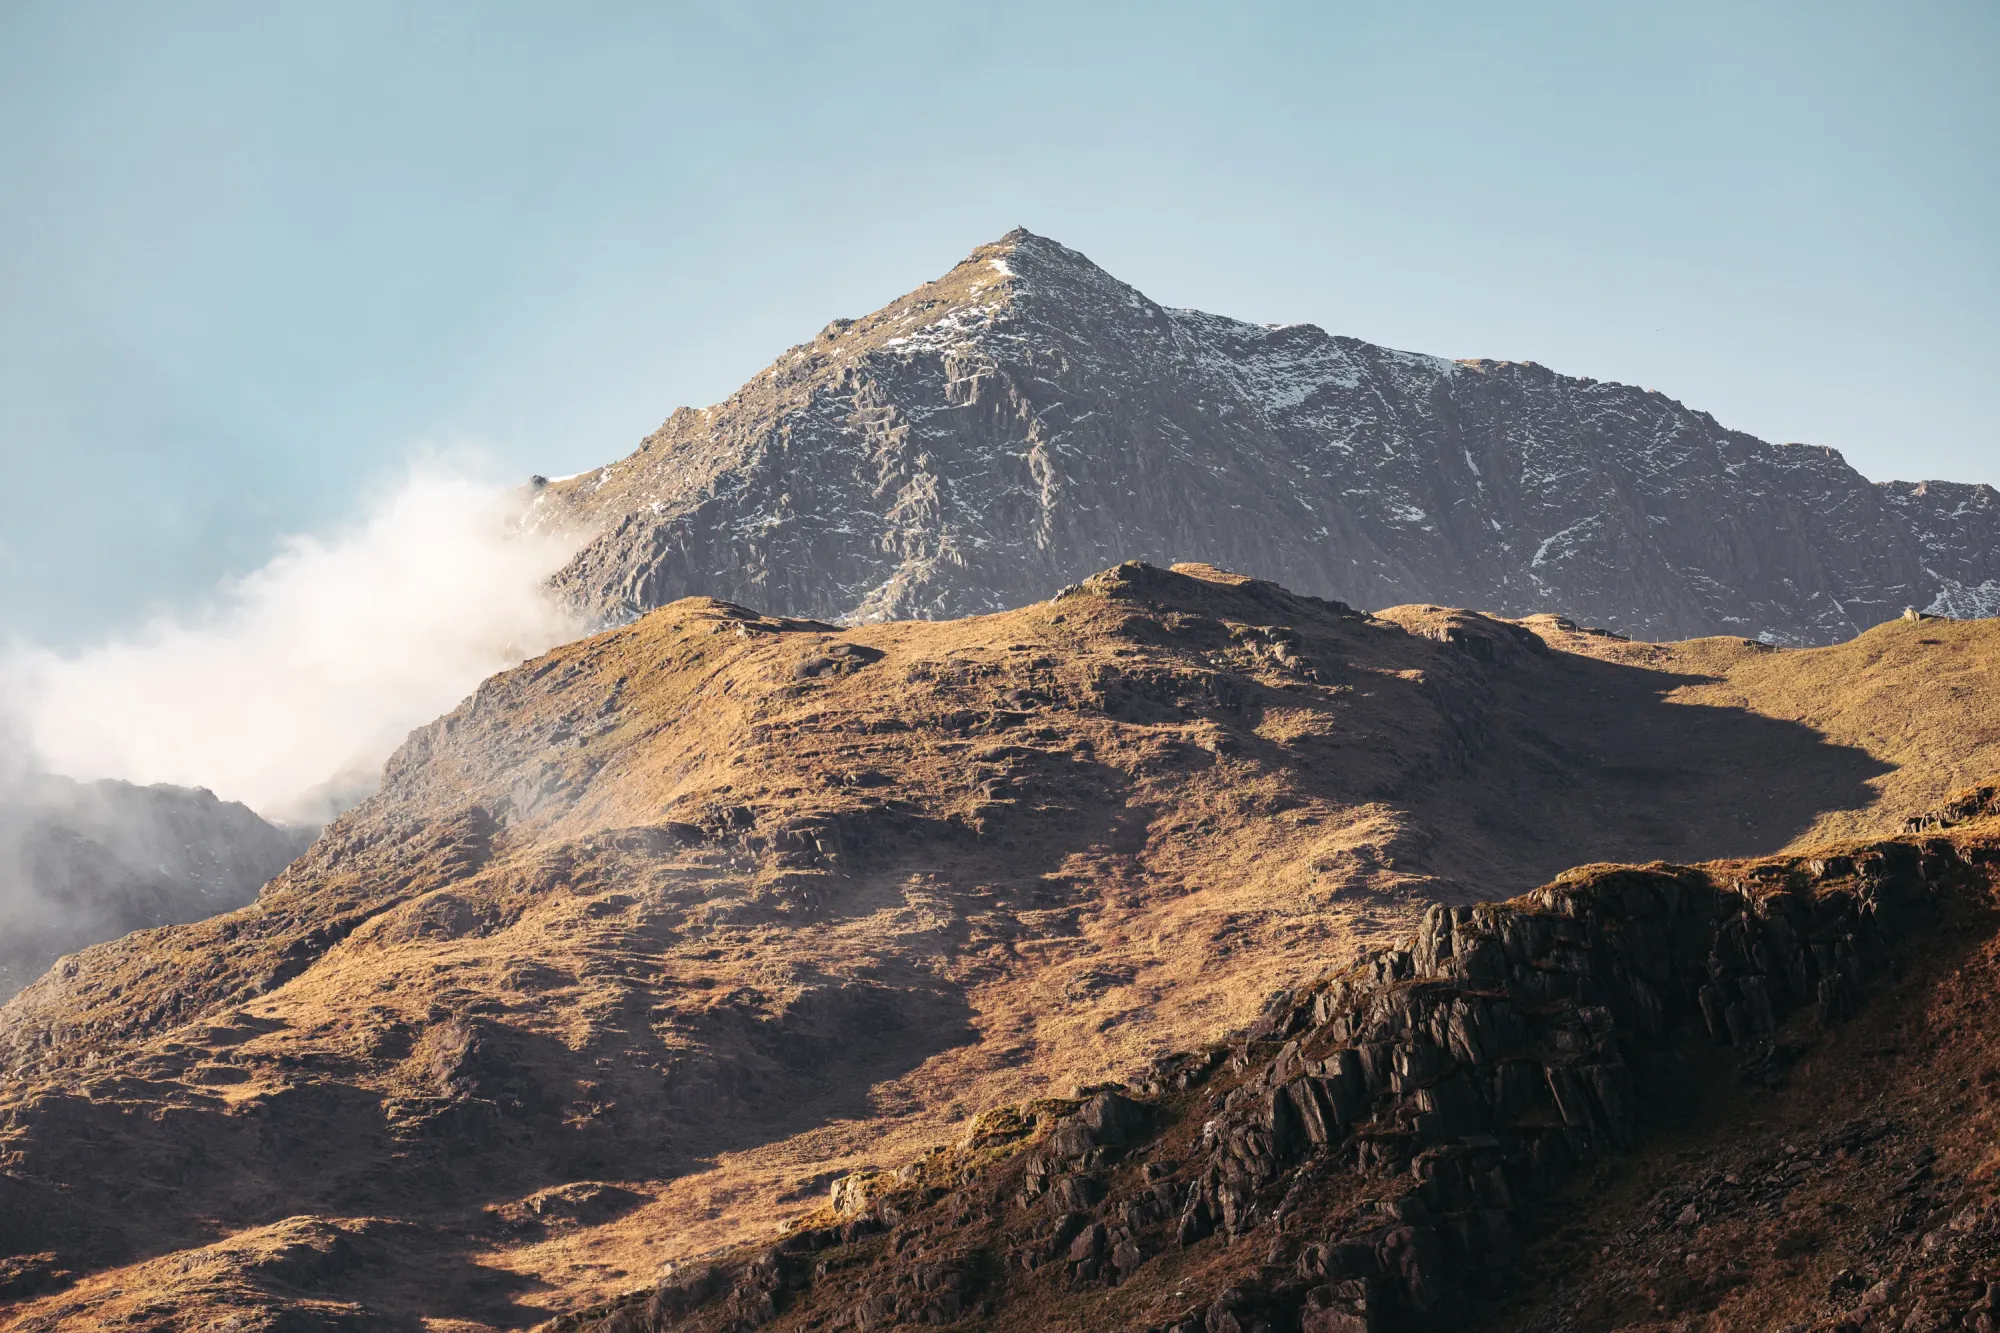
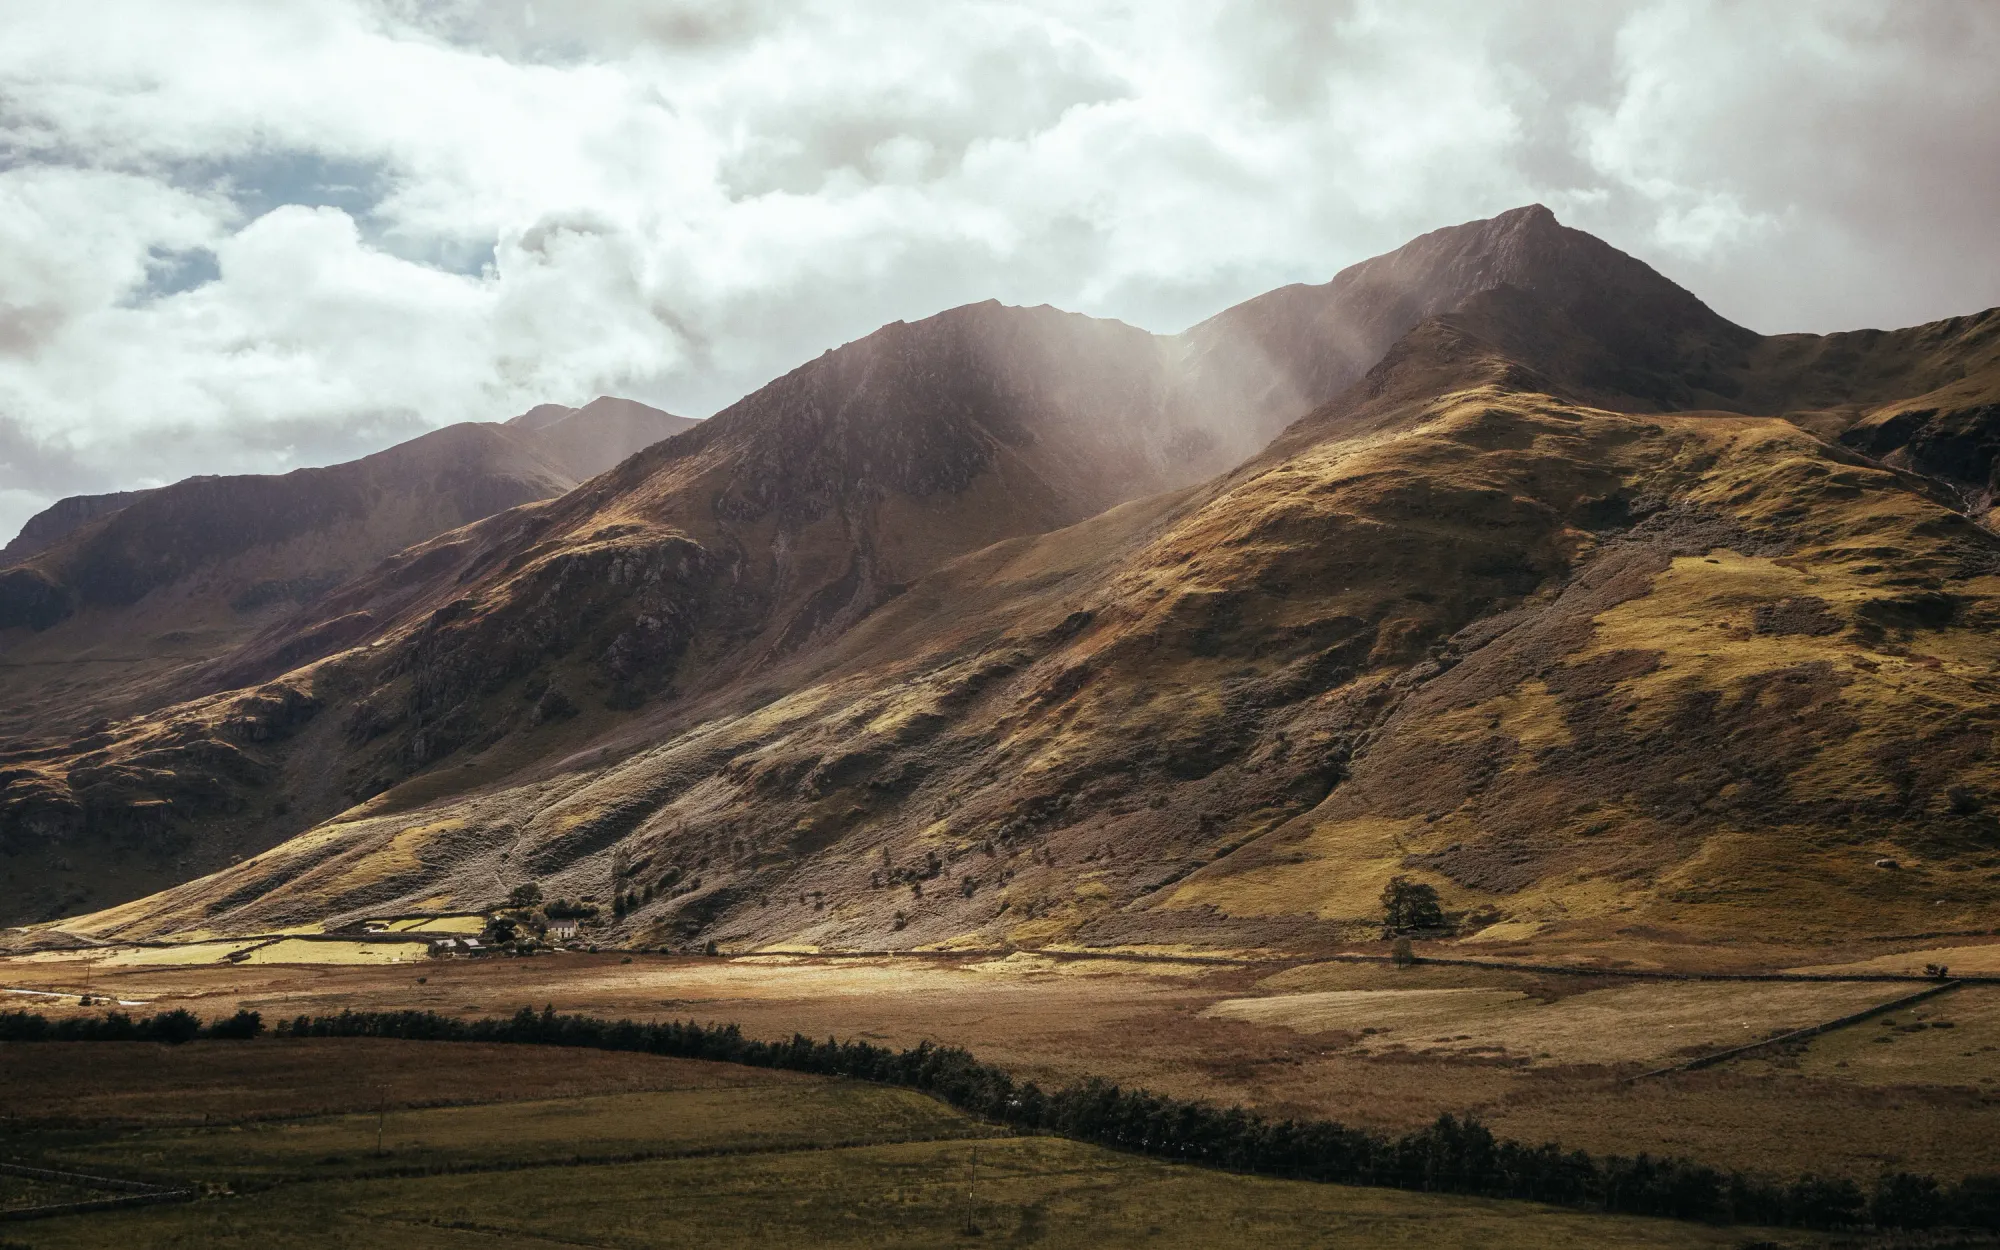
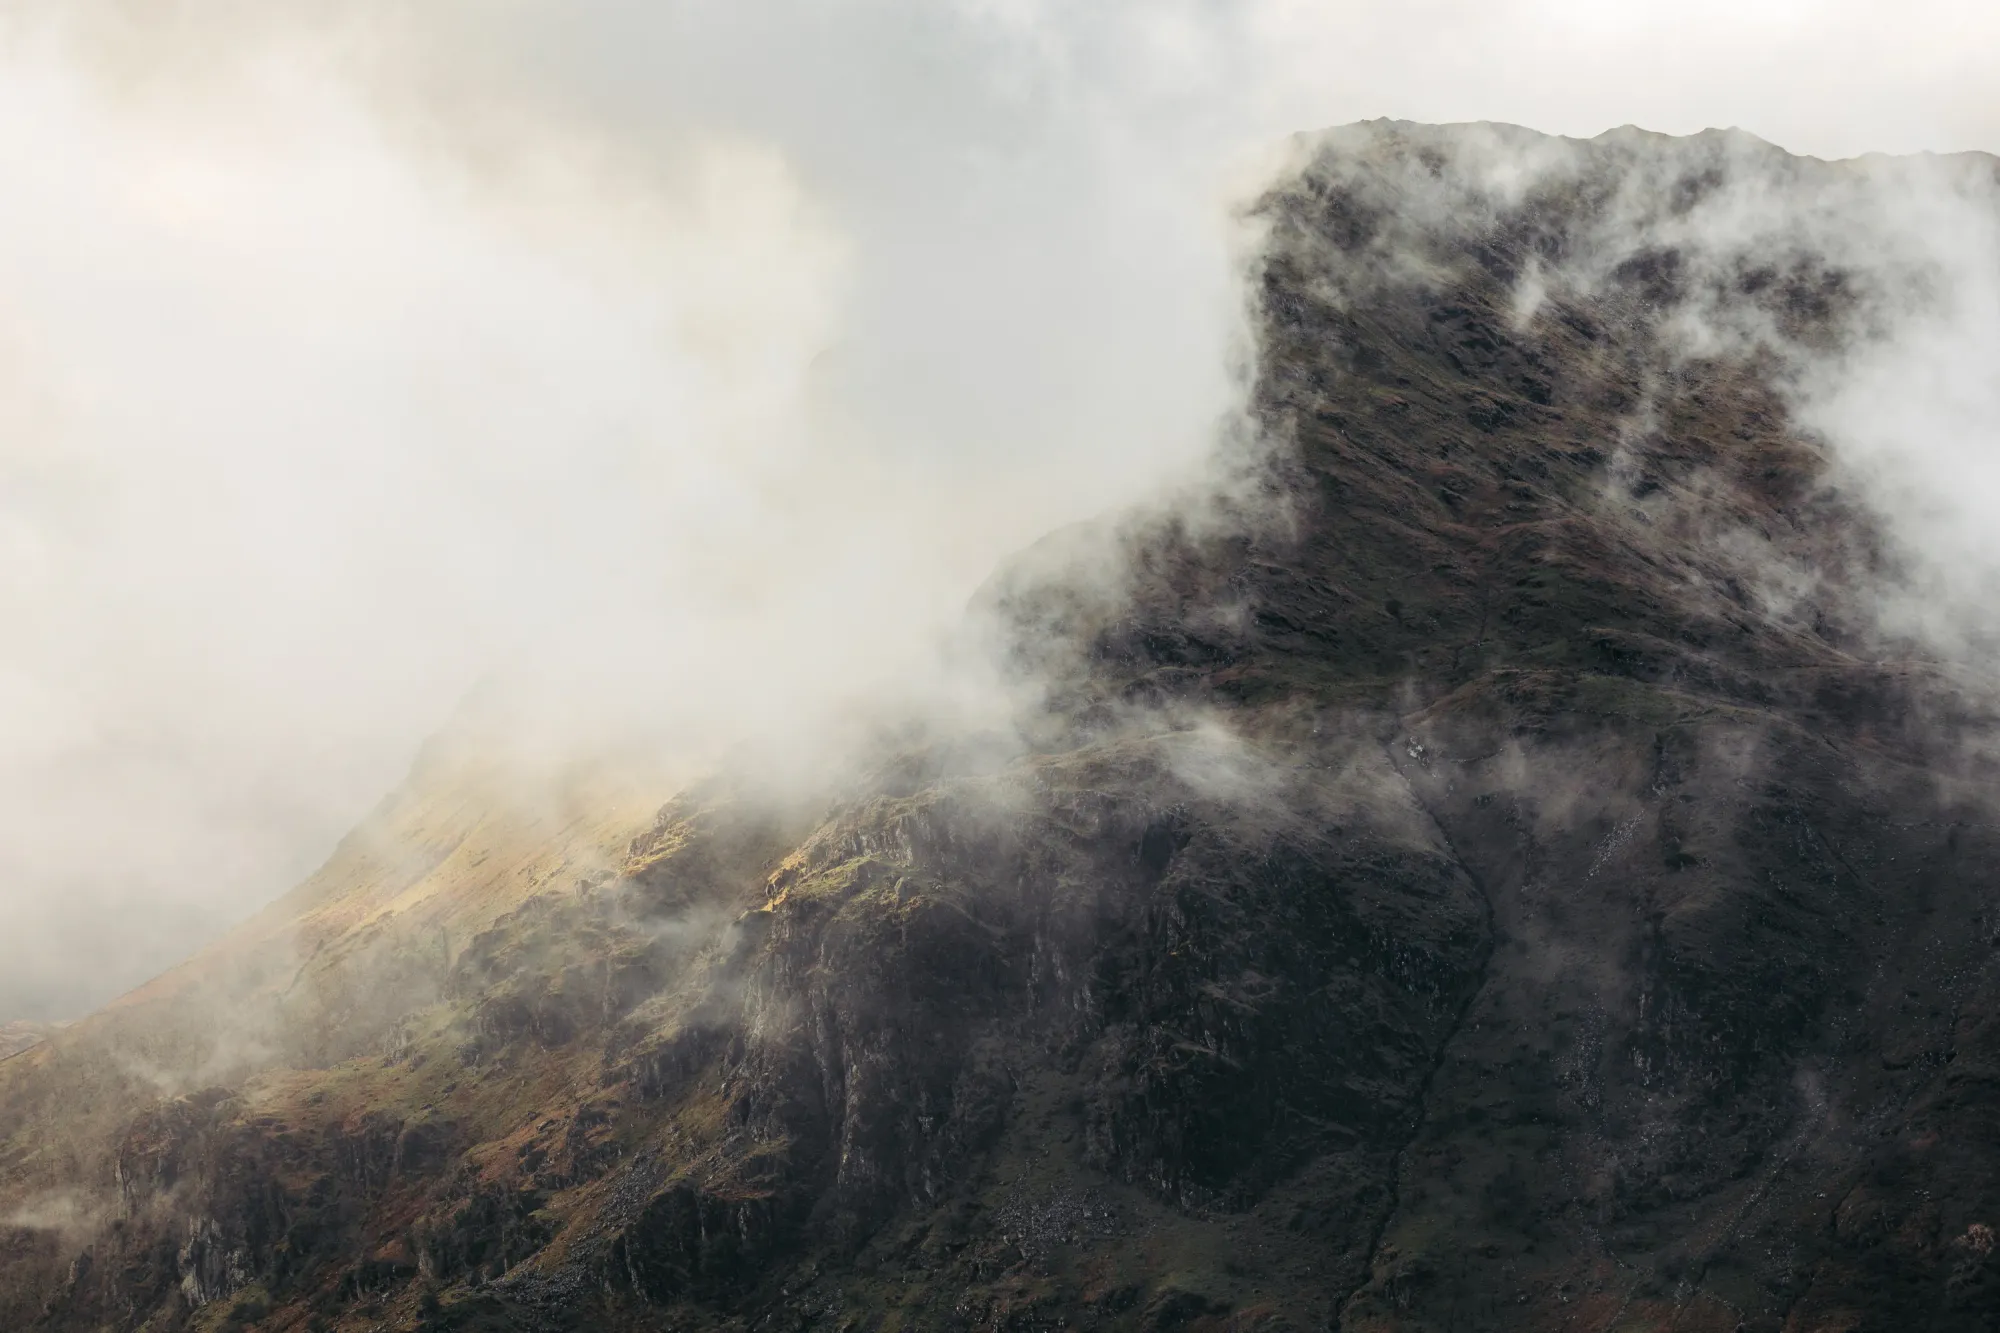
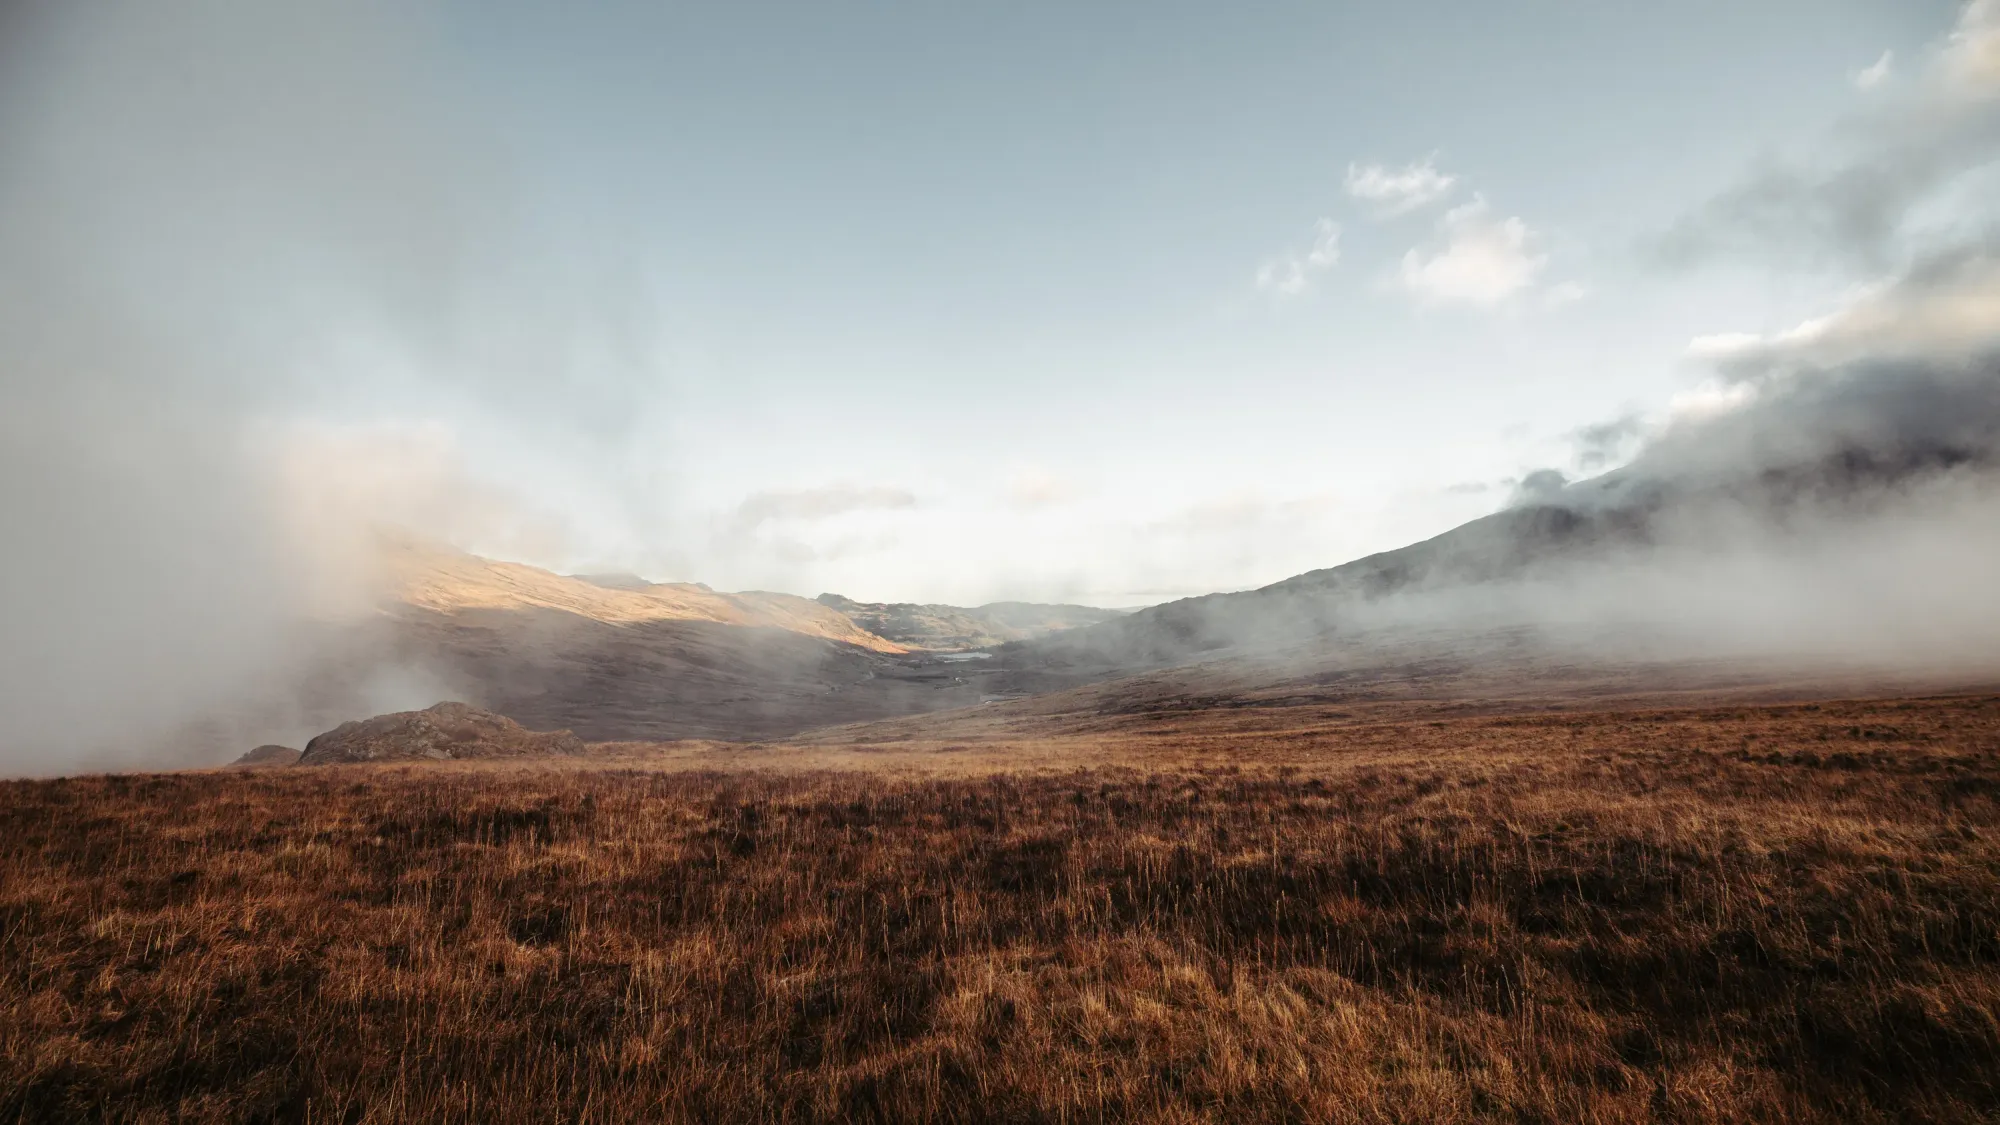
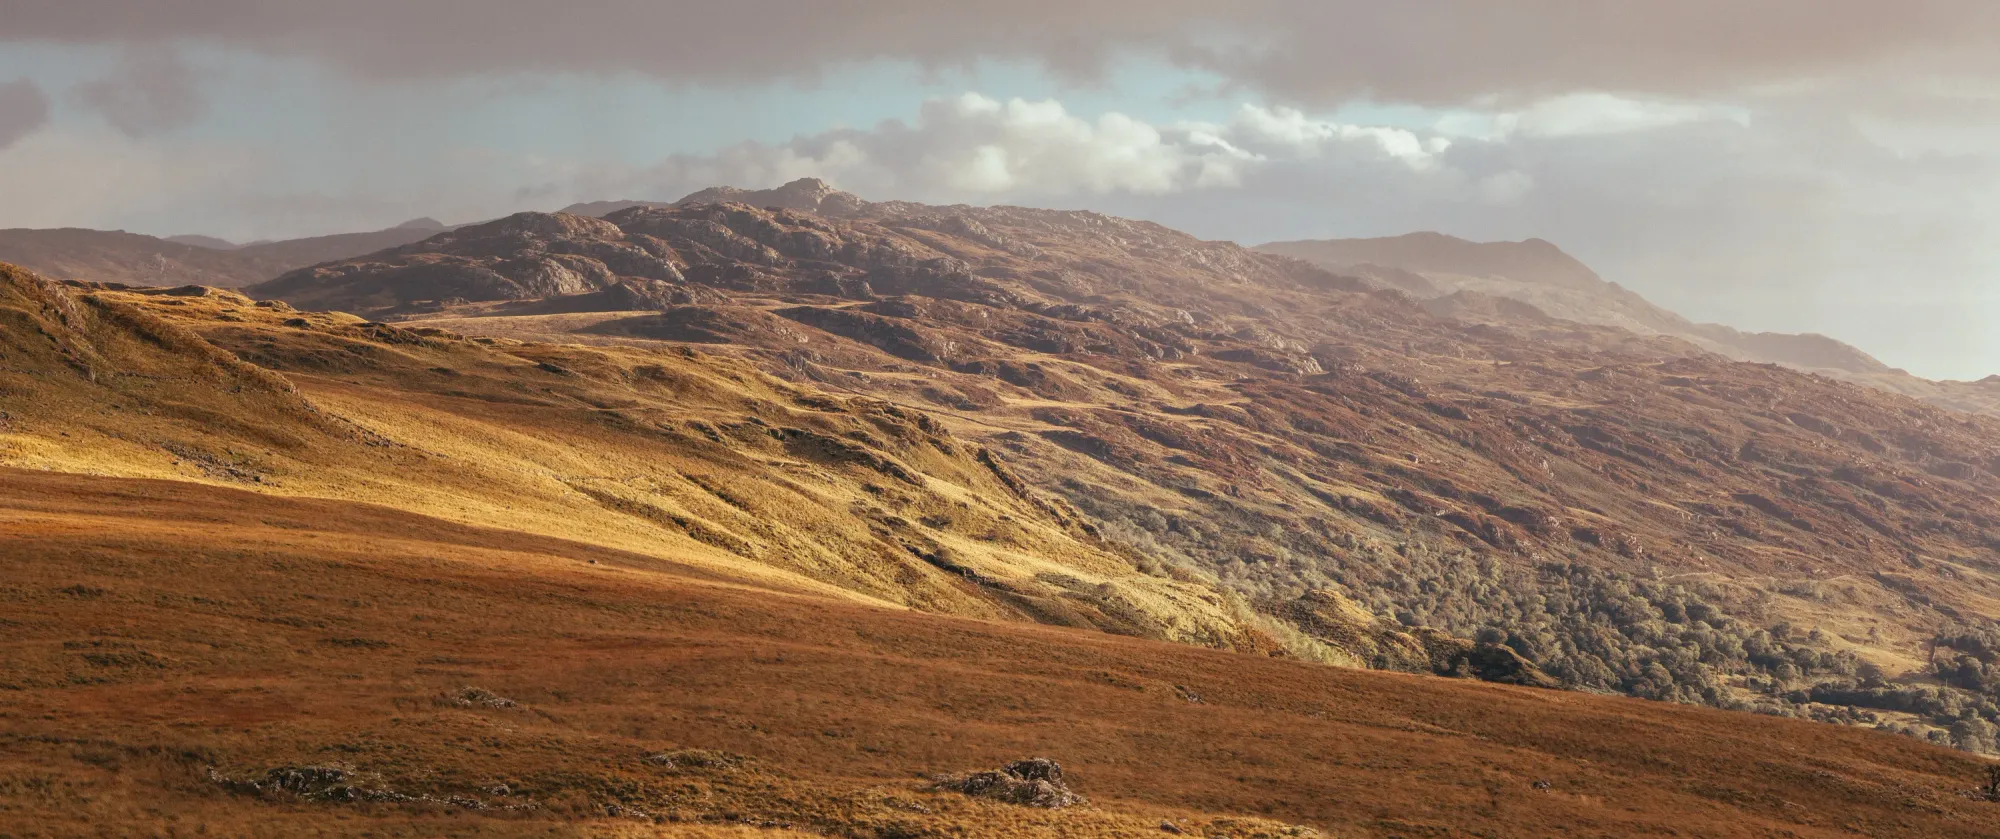
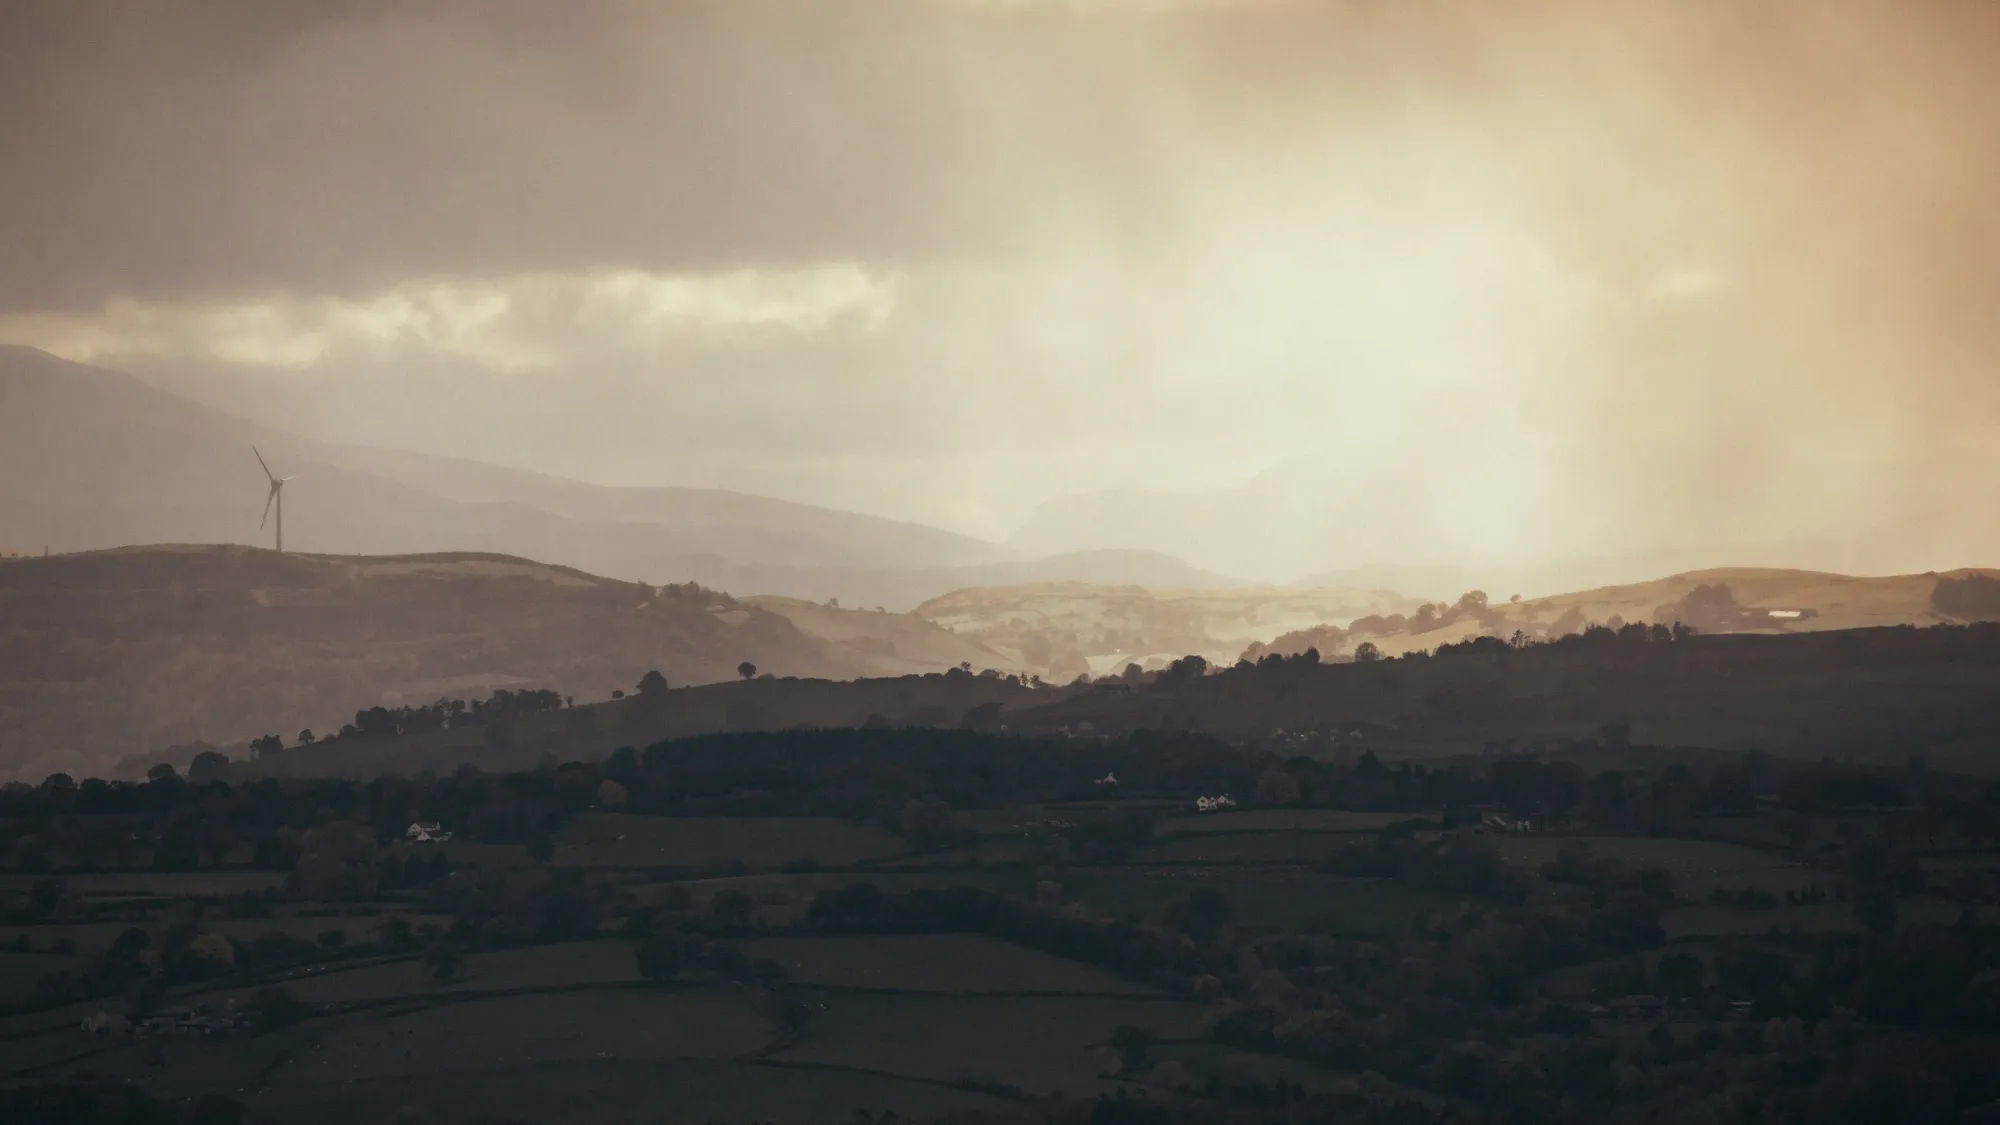
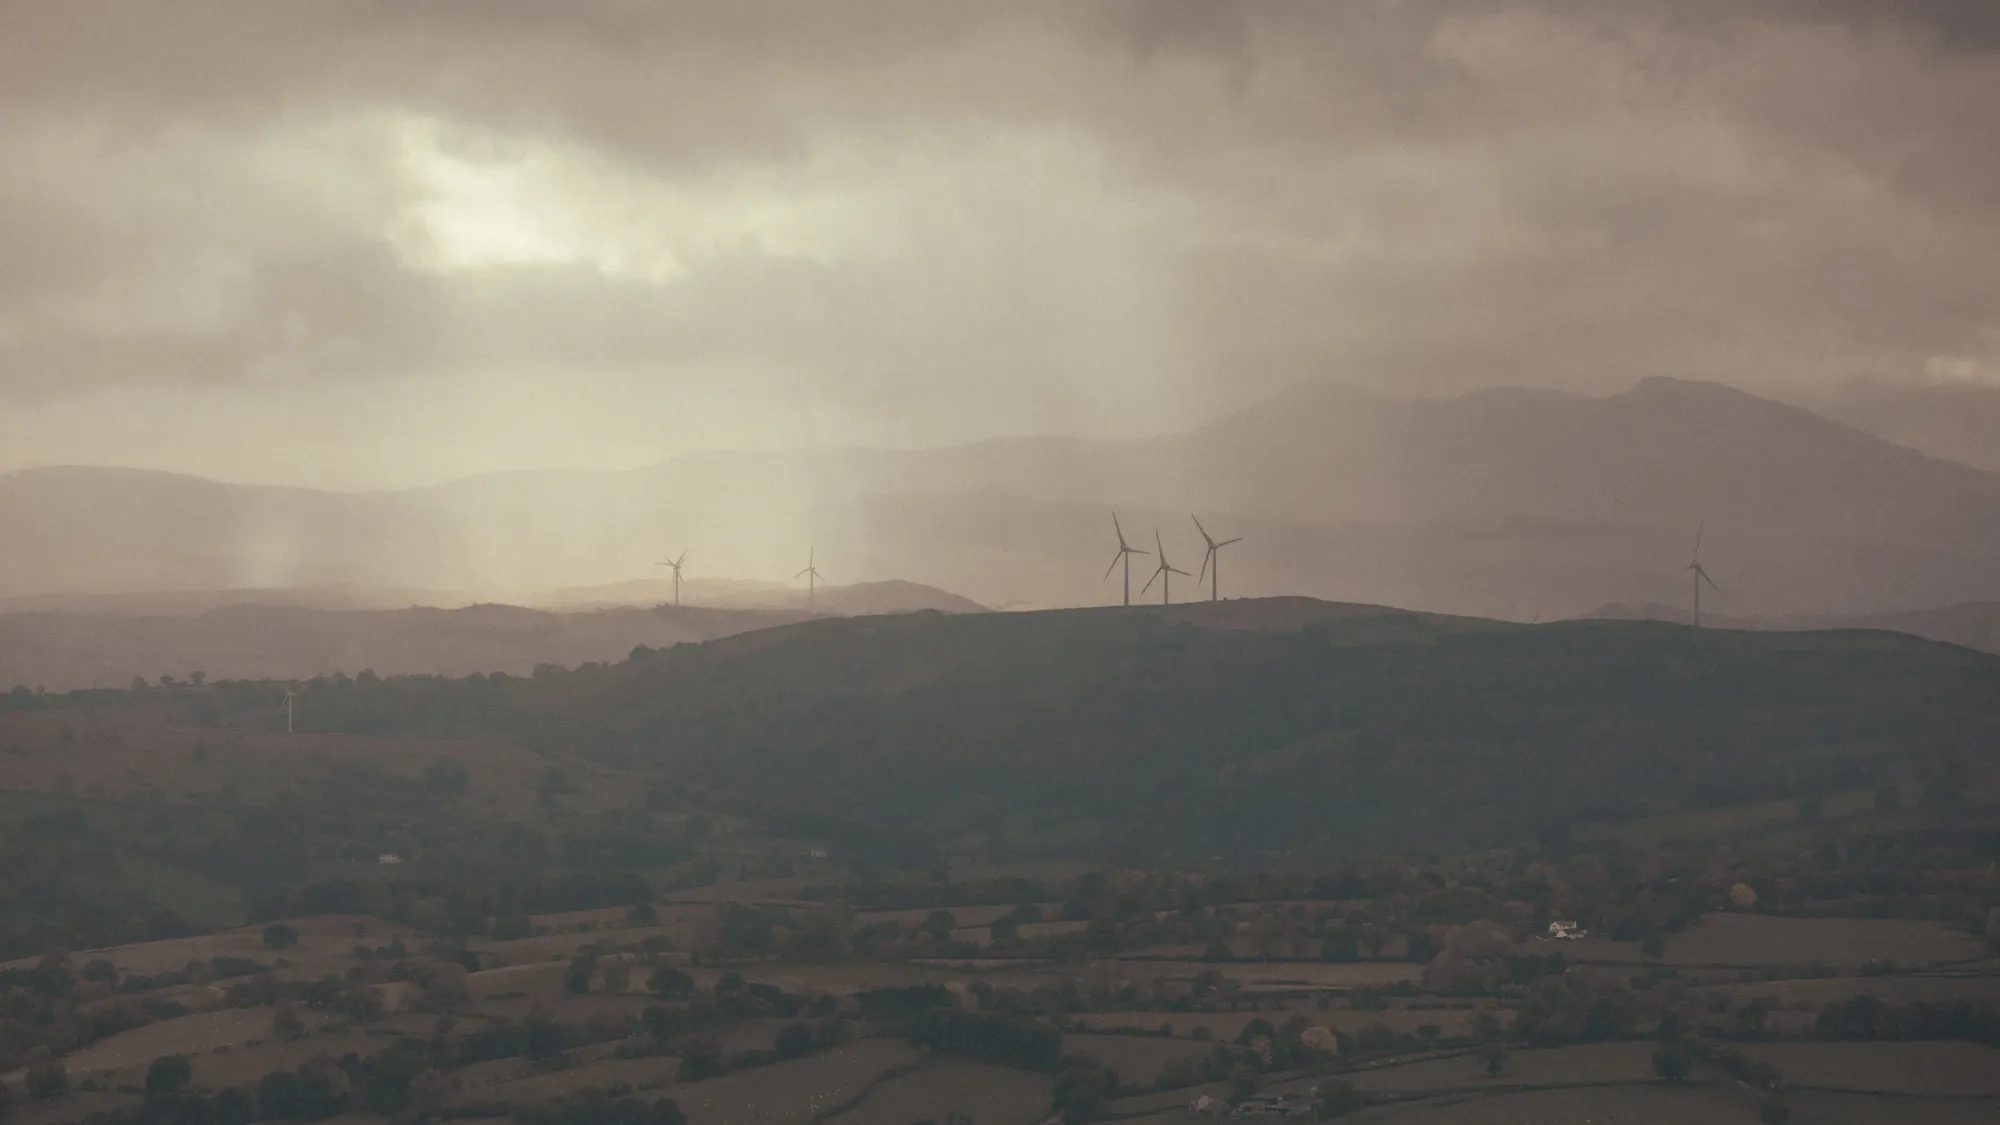
Eryri (Snowdonia), North Wales
As always, I spent a bunch of time out in the mountains of Eryri – my favourite place to unwind. It’s always worth a visit, no matter the weather.
I got really lucky with the conditions, especially at the start of the year where I got to experience the most amazing fog rolling through the valleys. I think I managed to level-up my photography game this year too.
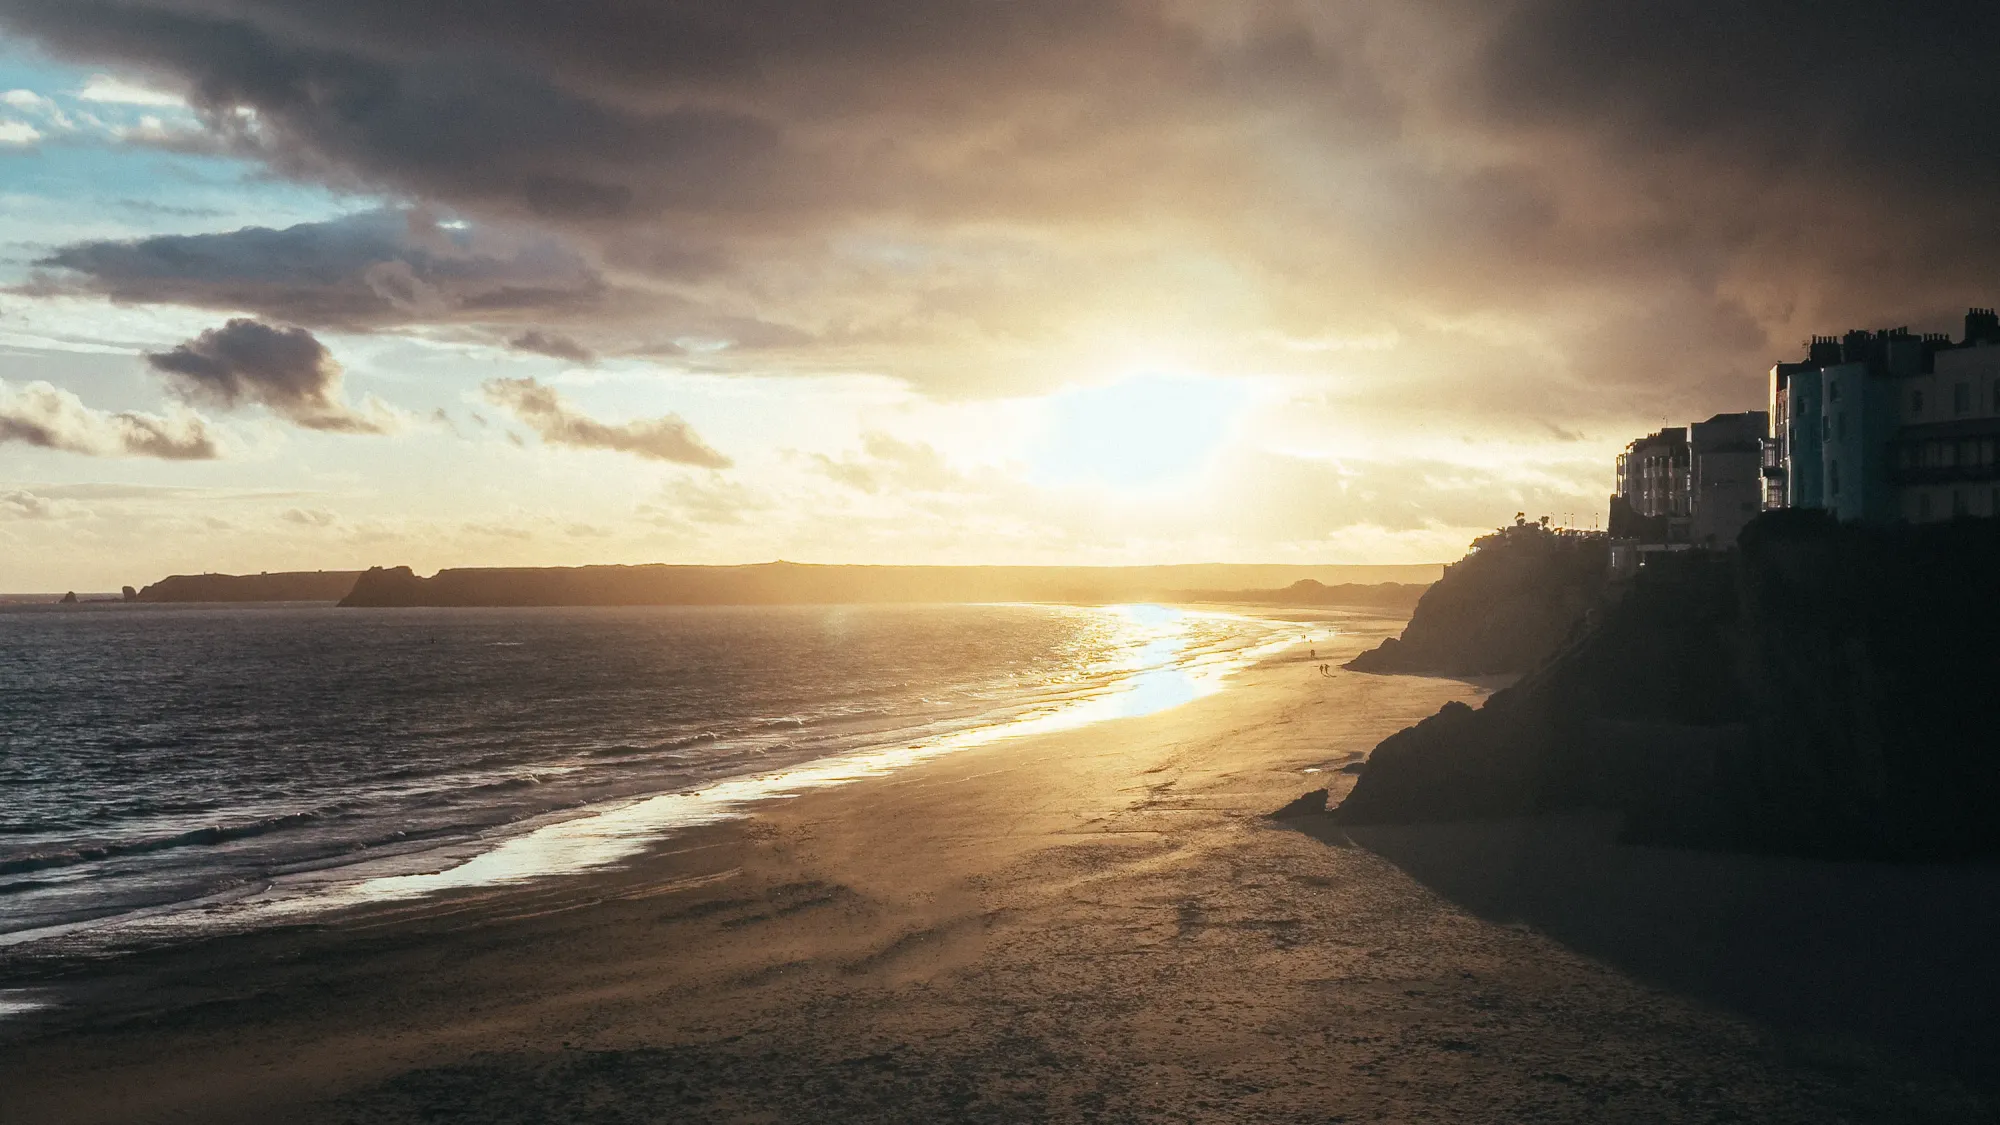
Pembrokeshire, South Wales
Not long before Christmas we spent a long weekend at a cottage in Pembrokeshire with friends and their super-cute dog. It was a lovely chilled trip and just what we needed to slow down before things kick off again in the new year.
I’ve visited that part of Wales once before a long time ago, though I don’t remember much about it. It’s very different to North Wales (less mountains), though no less beautiful. I really enjoyed visiting Tenby for the first time too, and was impressed yet again by the quality of the photos I was able to get on my iPhone.
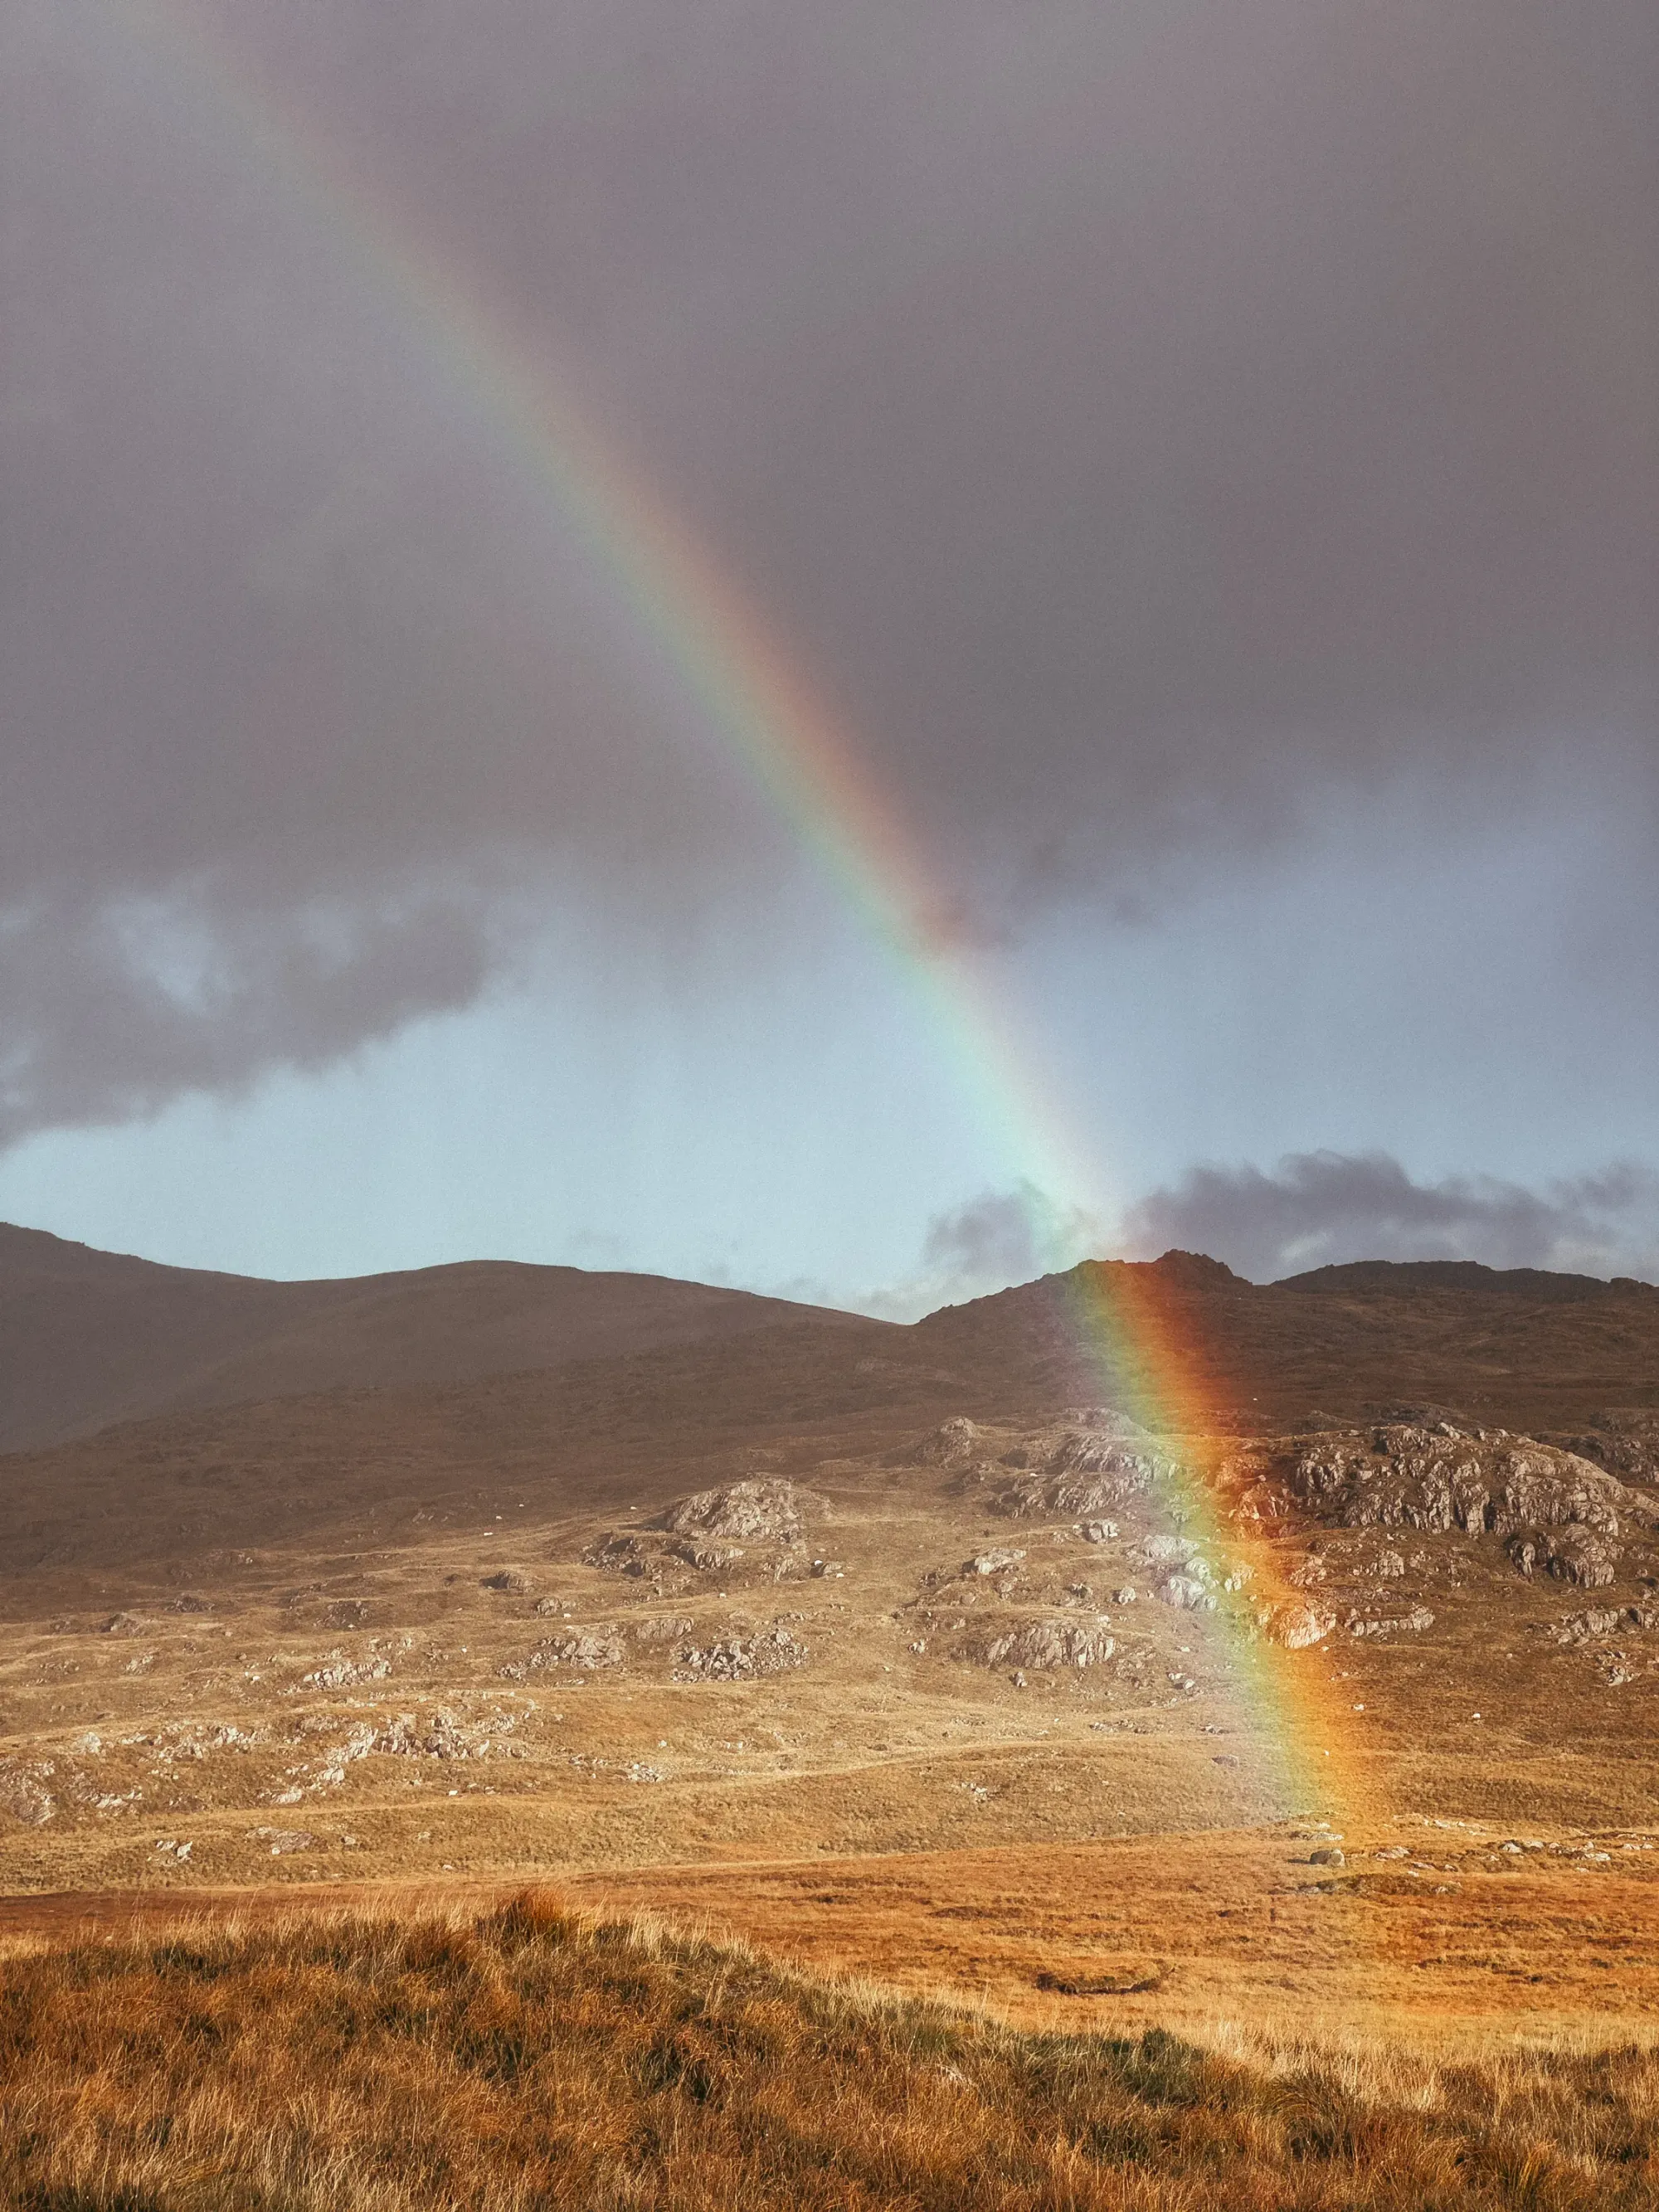
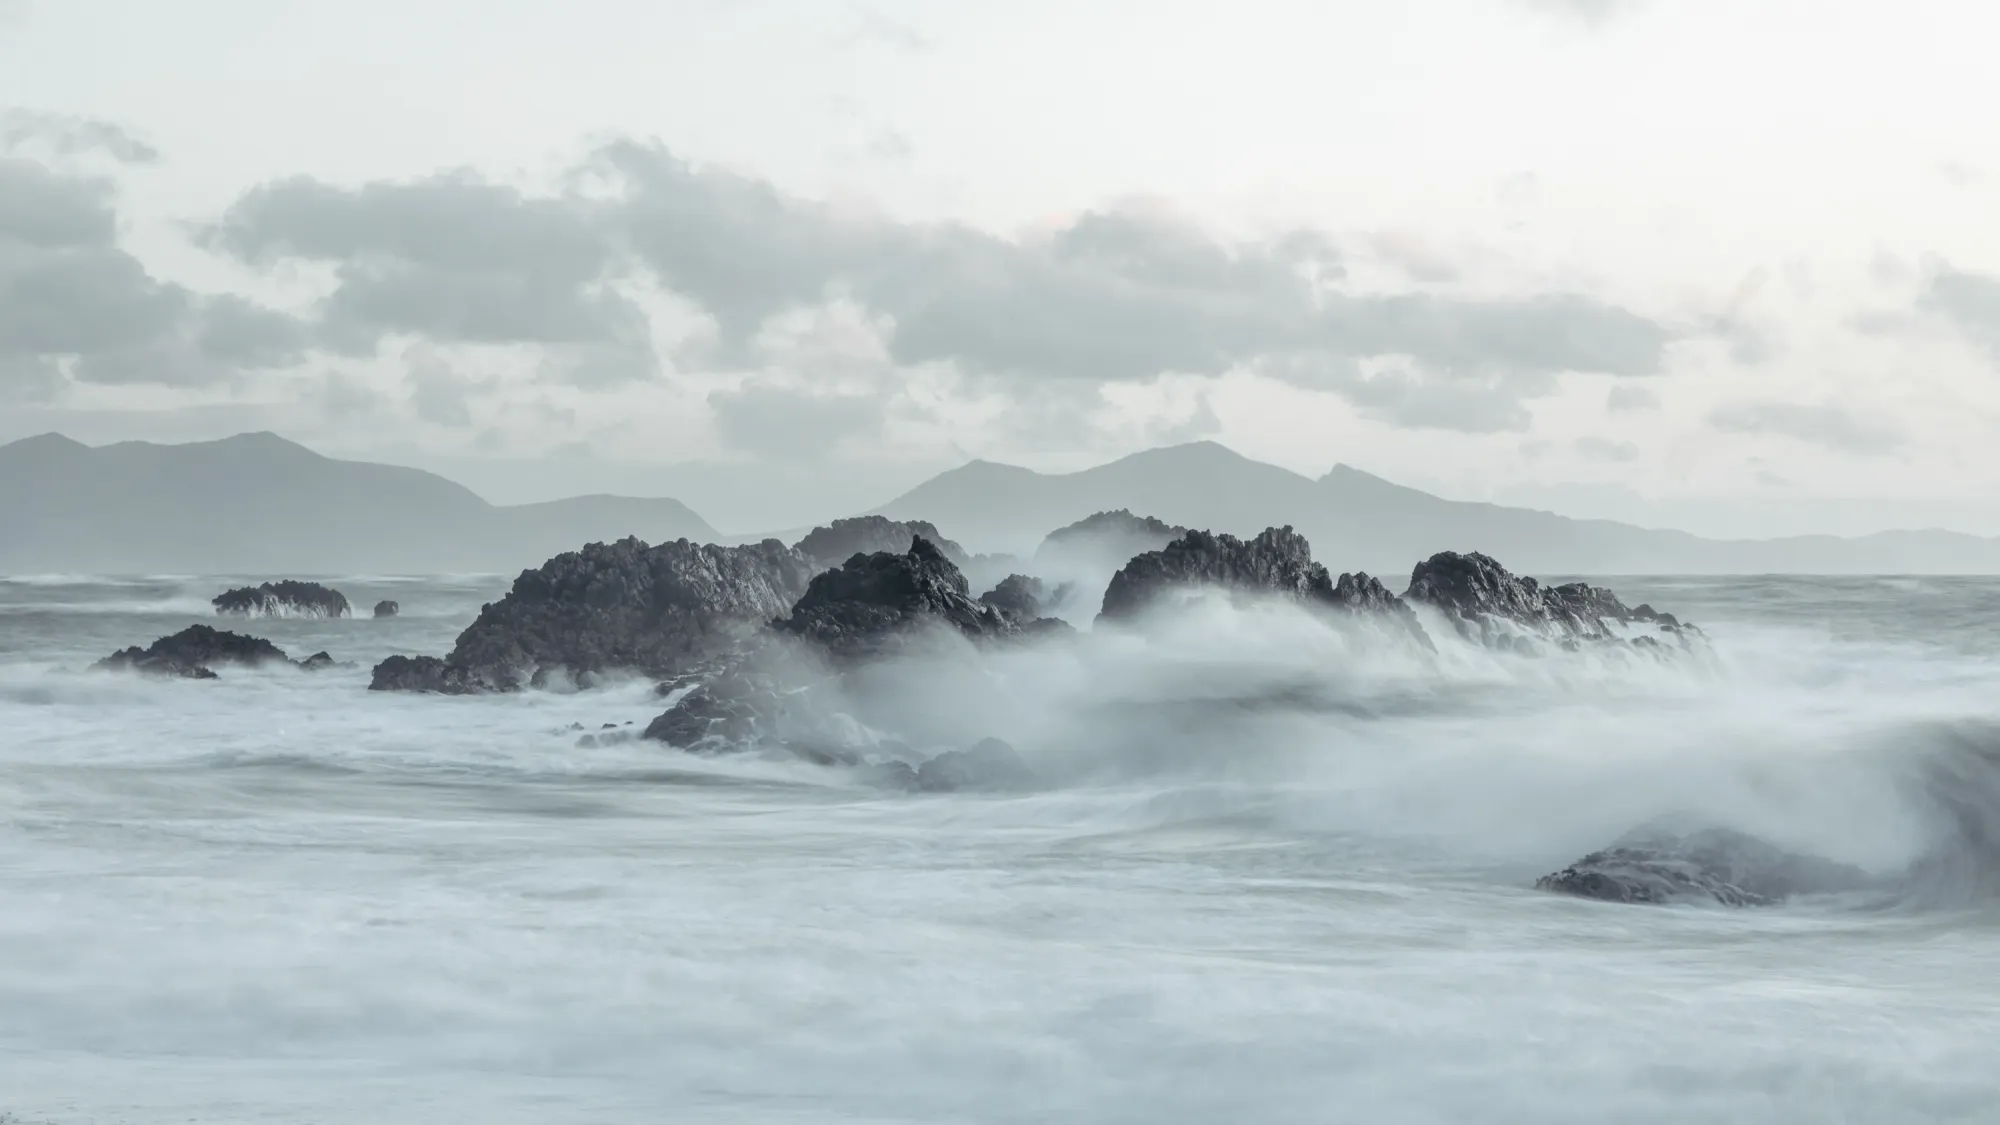
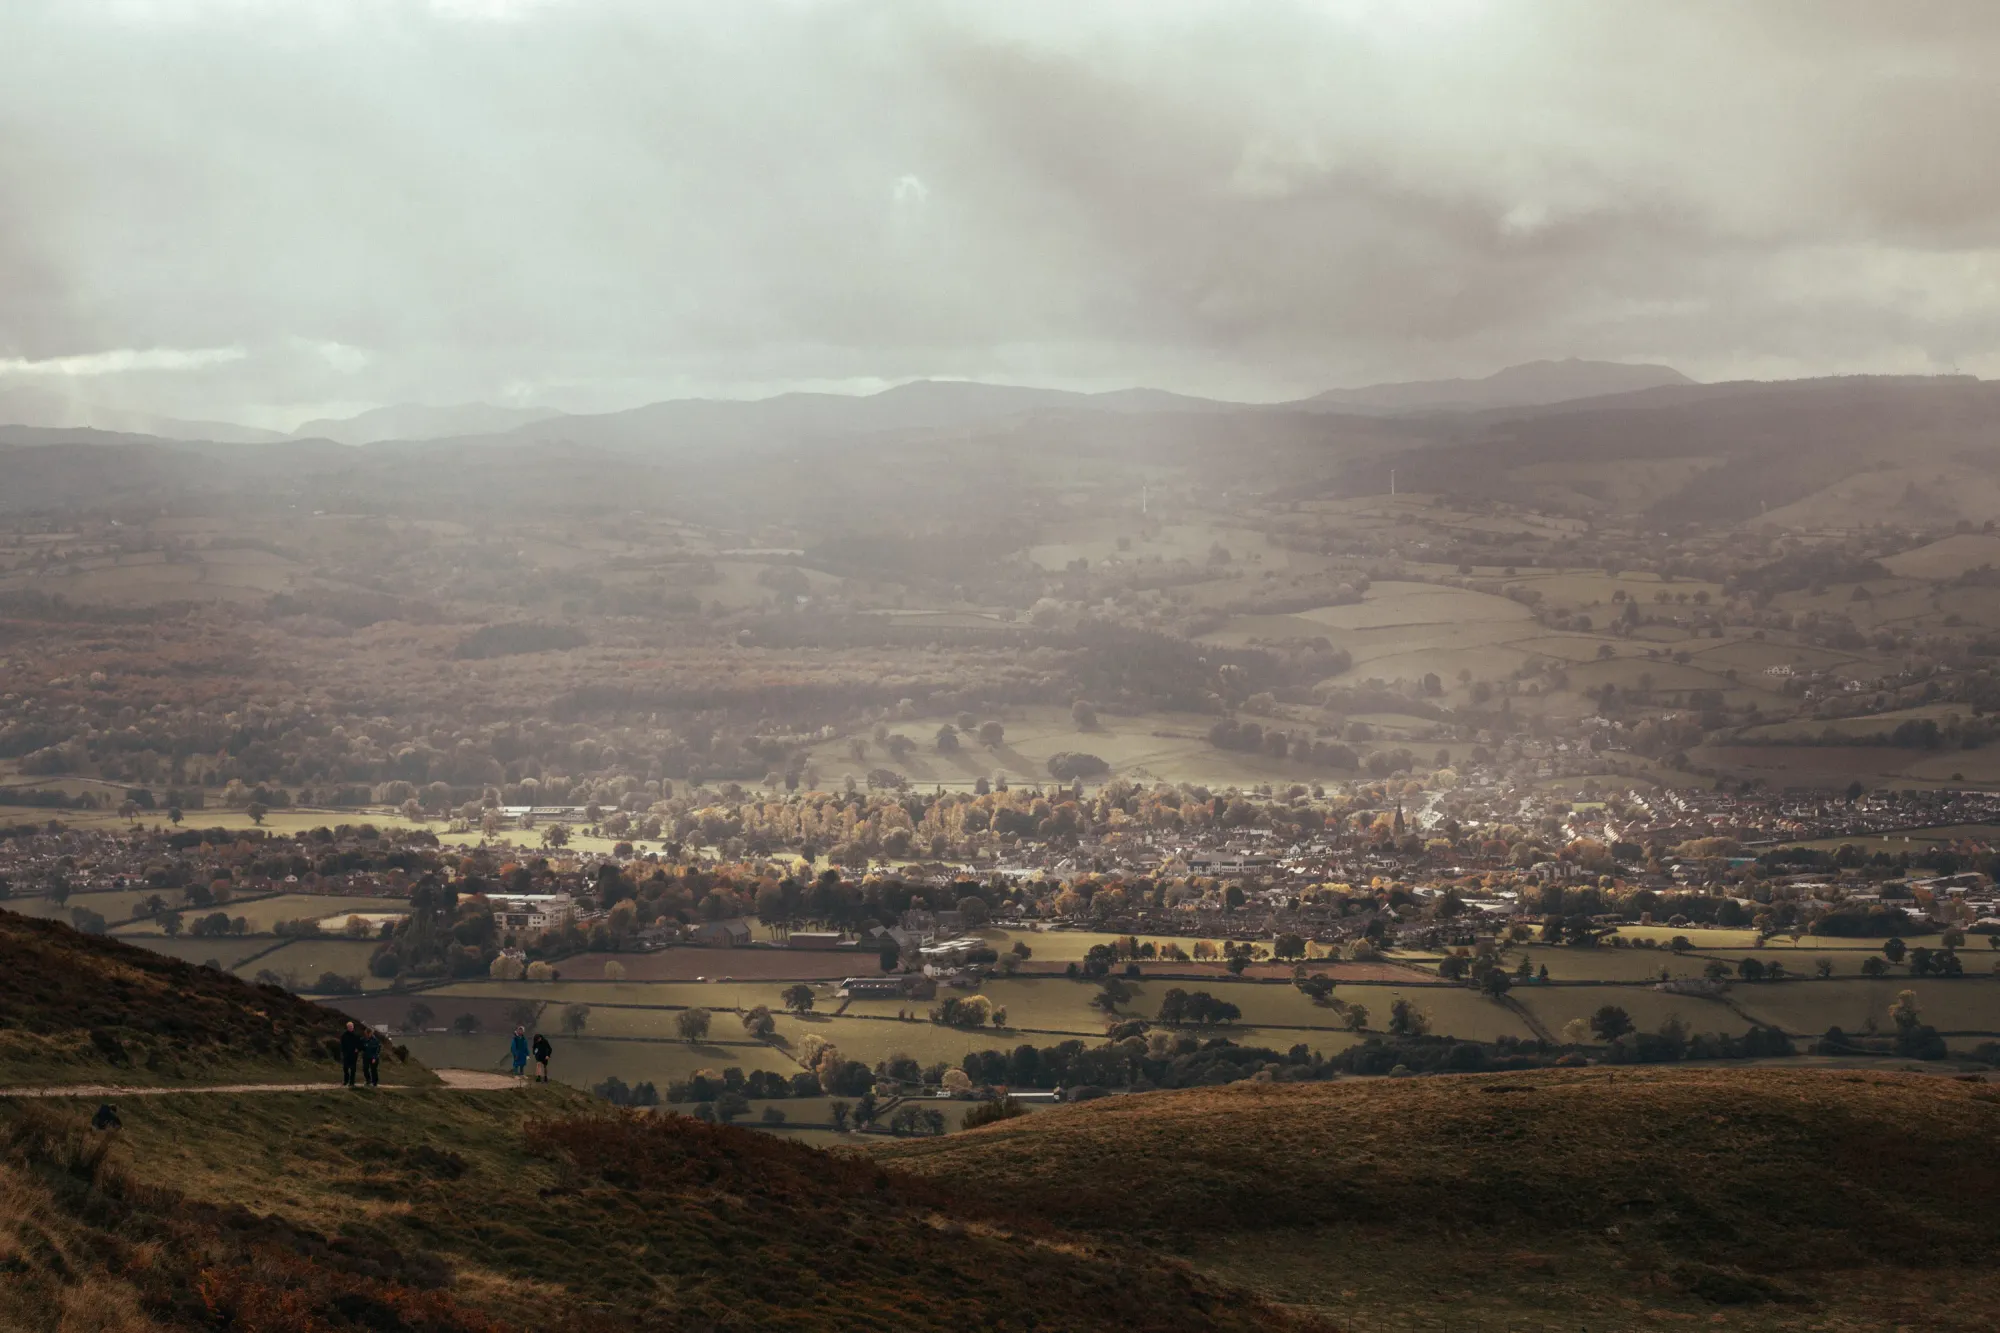
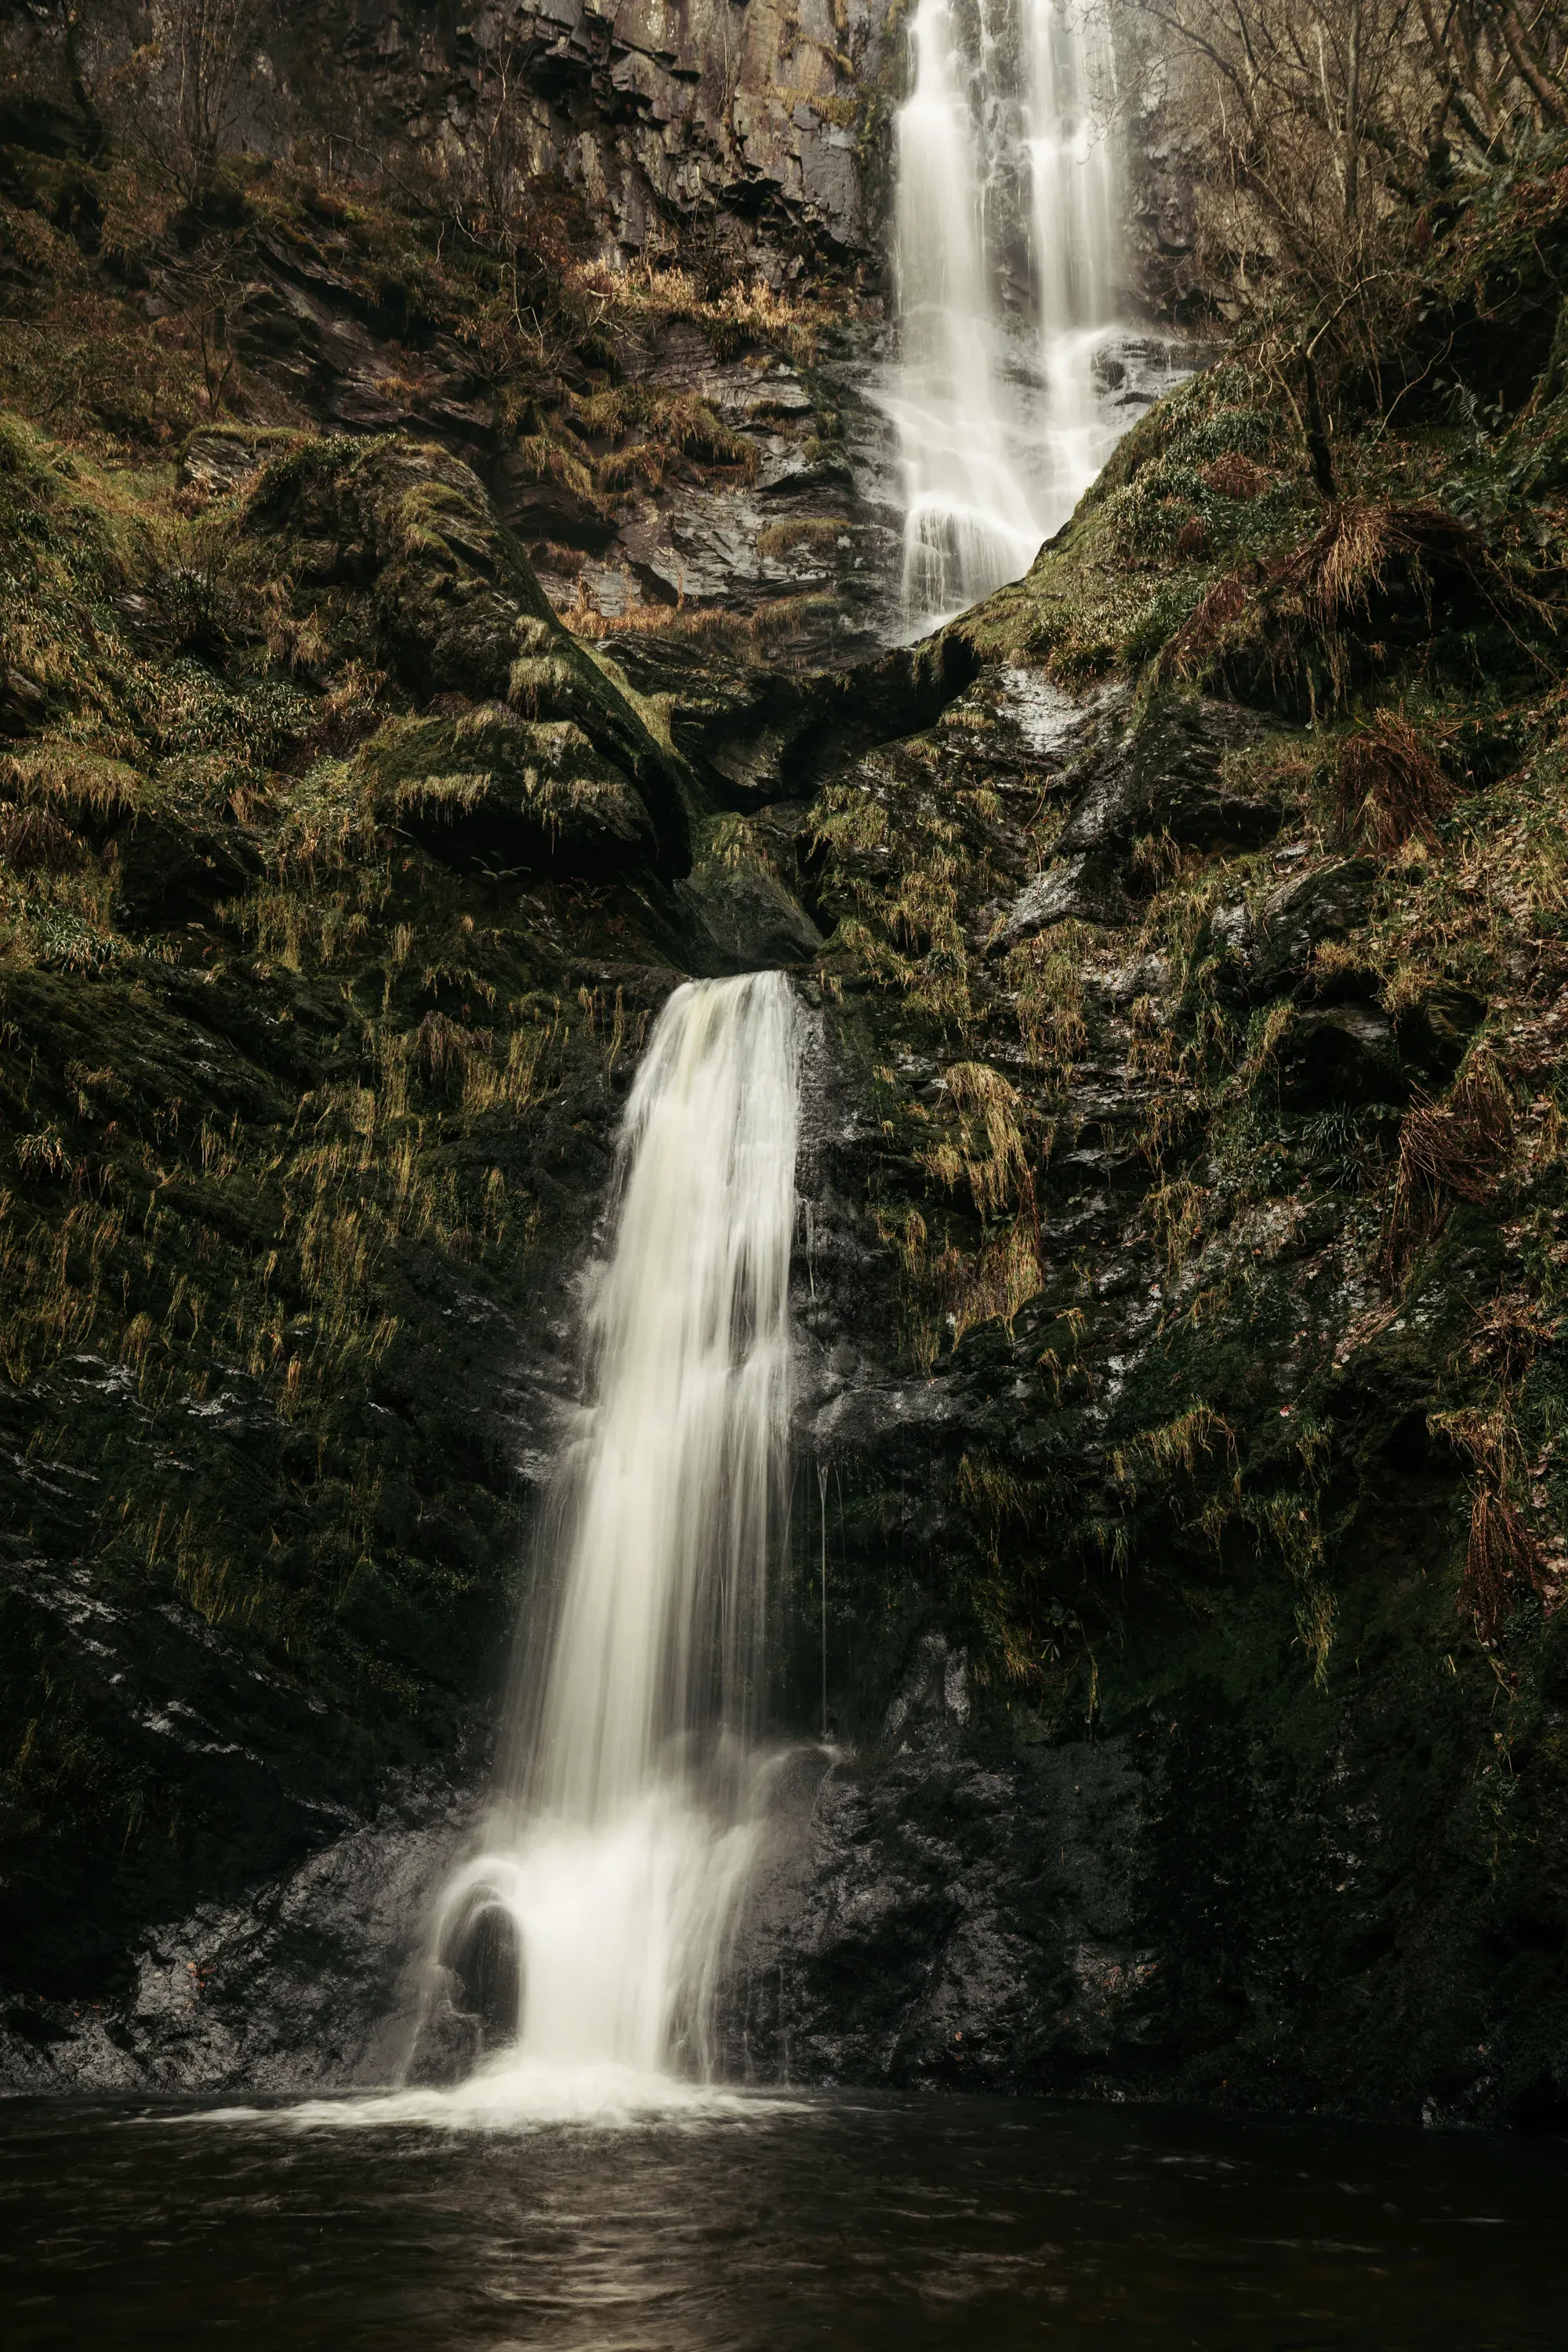
North Wales
If I’m not in Eryri then I’m probably out with my camera somewhere in the rest of North Wales. The year started out with some amazing stormy conditions in Ynys Mon (Anglesey) and we also had a bunch of refreshing and beautiful walks up Moel Famau, closer to home.

Wishes for 2023
I don’t really do new year resolutions, though I do think it’s healthy to have some broad wishes and goals for the next year to help keep you focussed.
Here are some of things I want to focus on in 2023:
- Continue immersing myself in the energy transition and learning more
- Read more books, especially on subjects I’m interested in
- Actually put some of my photos up around the house
- Continue rightsizing my possessions and getting rid of anything I no longer use, nor need (probably a lot of it)
- Look after my body better, even if just getting into a routine of working out
- Foster an environment at home that gets me away from the computer without feeling like I’m stopping myself from doing the things I want
- Get out to Eryri more often – I regret not going more this year
- Make my home office cosy and practical, and a bit less bland and clinical
- Work on a series of visualisations around understanding the electricity grid and technologies related to the energy transition
- Write more on the blog, at least starting a “today I learnt” (TIL) series
What about you? If you haven’t already then I’d recommend sitting down and listing out your own achievements over the past year, and what your wishes are for the next. It’s quite therapeutic and I bet you’ll be surprised at quite how much you actually did.
See you in the next one.