Introducing how to tell stories with data
Part one of a series on how to tell stories with data. This post focuses on the thinking that should happen before you even look at the data.
If I wrote about it, you'll find it here
Part one of a series on how to tell stories with data. This post focuses on the thinking that should happen before you even look at the data.
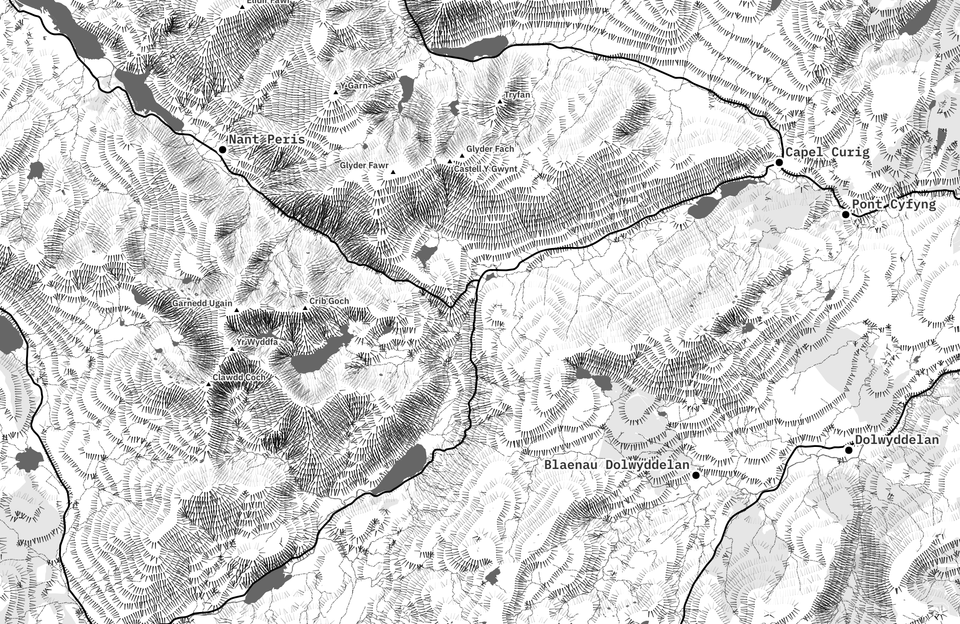
Detailed tutorial on creating a relief map in the hachure style using the latest features in QGIS.
Digging into the technology and services I use on my website, influenced by the ultimate goal of getting me writing again.
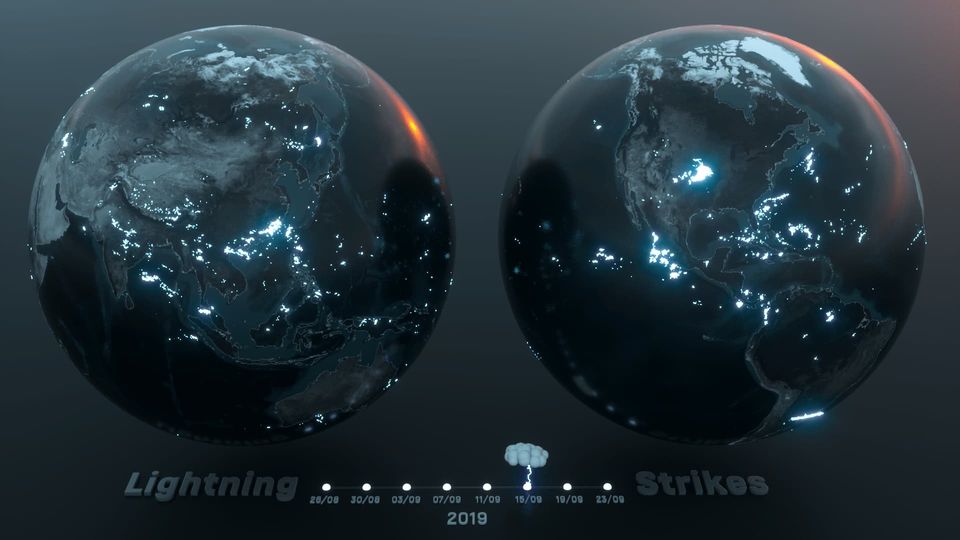
Craig Taylor and I recently collaborated on a series of spatial visualisations using global lightning strike location data. This is what we came up with!